Sunday, September 29, 2019

Should investors "chase high" on SCGM Berhad at RM 1.18?


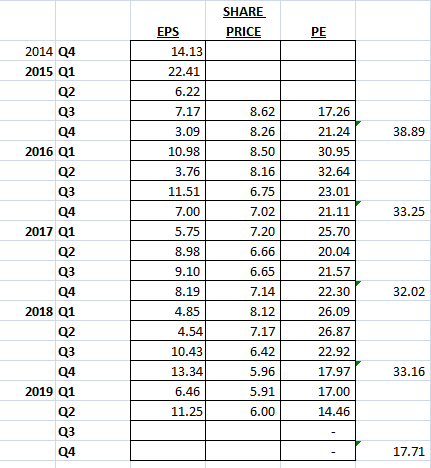
The share price of SCGM reached its peak in 2017 at approximately RM 3.20 before dropping 76%  to a low of RM 0.76 and recently rebounded 55% from its bottom to close at RM1.18 on 27 September 2019. So Is RM 1.18 a good entry price for Investor? To answer this question, we will do a comparison on its financial and share price for year 2017 & 2019 respectively. 

To be honest i think it is unfair to value SCGM based on net profit as it doesn't give a fair view on SCGM's operating profit due to its high depreciation incurred in 2019 through the factory expansion. Therefore, i would prefer to focus at its earnings before interest, tax and depreciation (EBITA)  and free cash flow to justify its core operating profit.

SCGM Financial in 2017 vs 2019 vs Q1 2020
  1. Although the net profit of SCGM shrink tremendously, its revenue continue to grow and expected to achieve a new high of RM 222 million in 2020. (there is definitely no issue in the top line as we are sure that the company keeps growing)
  2. As mentioned above, instead of looking at its net profit i would prefer to focus on its EBITA to have a better view of its operating profit. EBITA dropped from RM35 million (2017) to RM 18 million (2019), a drop of 48%. In Q1 2020, SCGM posted an earning before interest, tax & depreciation of RM 7.2 million. Assuming if SCGM is able to achieve this in the remaining 3 quarters, the full year EBITA would be RM 29 million. (At least we know that SCGM is still having positive core operating profits and do take note that its EBITA margin in Q1 2020 improved to 13.05% from 8.47% in 2019).
  3. Its interest and depreciation for 2020 is expected to be RM 5.4 million and RM 14.8 million respectively which is same as 2019, therefore i would safely say that the worst is over.  
  4. SCGM gearing ratio reduced from 64% in 2019 to 59% in Q1 2020. (As long as SCGM continue to reduce its debts, the interest expenses should reduce as well hence increase its free cash flow)
  5. Next we will look at its cash flow. The free cash flow generated by SCGM in 2017 is RM 77 million while in year 2018 & 2019, its free cash flow is negative due to capex on expanding its factory.  However we can see that its free cash flow is positive again at RM 9.5 million in Q1 2020. (Assuming if SCGM is able to maintain its free cash flow at this level for the remaining 3 quarters, SCGM is able to generate a free cash flow of RM 38 million. Currently SCGM has a bank borrowings of RM 96 million, with RM 38 million of free cash flow per year, SCGM is able to bring down its gearing ratio to a comfortable level in 3 to 5 years time).
  6. SCGM is a company that is willing to share its profit with its share holder as it used to have a dividend payout ratio of 60 - 70%. However in recent years, due to its tight cash flow and lower profit, dividend drop massively. (Assuming if SCGM is paying 0.25 sen of dividend per quarter, full year dividend paid will be 1sen which is equivalent to a yield of 0.85% at the price of RM 1.18. SCGM will not be a dividend counter until it pair down its debts).\

Now back to the questions on should investors "chase high" on SCGM Berhad at RM 1.18? 

In point 2, i did an assumption that the full year EBITA for 2020 would be RM 29 million up from RM 18 million in 2019, an increase of 61%. Share price of SCGM had rebounded from the rock bottom of RM 0.76 to RM 1.18, an increase of 55% which means the current share price is reflecting its earning for the remaining 3 quarters in 2020.  

With this i conclude, if SCGM is able to achieve an EBITA of RM 29 million in 2020, its share price should be somewhere RM 1.20 - RM1.30 to be fair.

However there are more that we should look at for future share price movement.

Below is some sharing by 笔随意走

SCGM AGM 简报 (Sept 24,19)
- 自从搬迁到新厂后,总产能达到每年6.2万 吨 (62.6million kg)
-目前的产能使用率大概在40-50%, 最佳舒适使用率预测是70%左右,希望可以在此财政年FY2020 第四季度可以达到(明年年4月之前)
- 三分之一的营业额来自出口,区域则来自本地
- 可生物降解(biodegrable )产品目前是占了少于 10%的生意量,原因是 太贵,市场不接受
- 原料(resin)占了生产成本的大概60% (原料品种:PET, PP, PS)
- 原料供应商源自本地
- 原料吨货量大概 1.5 个月 (属于最佳时限,不会卡cash flow)
- 目前原料低价是好事(自从四月开始),凡生产的产品任何起跌价都会有lag effect ,不会马上反映出来
- 贸易战受惠 订单转移
- 受惠于本地食品行业的蓬勃发展(最近流行打包,foodpanda 那些,有助提升产品需求)
- 政府减少塑料产品使用政策的影响: 短期内还没有真正可以取代plastic 的原料,plastic依然是消费者首选
- 盈利逐渐恢复,上个财政年出现亏损因为新建筑物和机械开始减值,搬厂额外开销,原料价格高企
- 资产折旧 建筑物:摊平二十年,一年比以前多RM 2mil ,至于机械则为10年


Thursday, September 26, 2019

AEONCR Q2 2020

  1. Revenue increased by 19% to RM 783 million which accounts for 57% of 2018's revenue. 
  2. Total operating expenses increased 38.4% to RM 521 million where its gross profit margin dropped to 33% which is way below its benchmark of 40% - 45%. (The reason for this is because of RM248 million of impairment loss from financing receivables. Please take note that the full year impairment loss from financing receivables in 2019 is only RM 308 million. Meaning to say 2 quarters of impairment has already accounted for 80% of 2019 impairment. The reason given by the management is due to the requirement under MFRS 9 )
  3. Interest expenses increased by 29.7% to RM 155 million because of increase in borrowings which is inline with its increase in revenue (Revenue ⬆ 19%, borrowings ⬆ 15%, Interest ⬆ 30% - revenue increased more than its borrowings should be a good sign however its increase expenses increase twice more than its borrowings isnt very good).

  1. Revenue ⬆ 19%, net financing receivables ⬆ 10%, borrowings ⬆15%, total asset ⬆ 11%, total liability ⬆ 14% (Overall increase in borrowings is in line with increase in revenue and increase in its financing receivables which is very fair however the overall increase in liability is higher than the increase in its total asset isnt that nice)
  1. Core operating profit increased by 16% which is inline with the increase in revenue (meaning to say the fundamental of Aeoncr didnt change as the operating profit actually increase)


  • The management will focus on quality of loan as well as enhancing the company efficiency. (worth to take note that in Q1 2020, the management says that the financial performance in 2020 will maintain but in Q2 2020, the management no longer mention it. This could mean that 2020 financial performance is not gonna be satisfactory)


Comments

In this kind of economic environment, Aeoncr deserves an applause for delivering a record high revenue. However its profit was being dragged down by its impairment loss on receivables. Assuming if the impairment amount is same as 2019 which is RM 152 Million, Aeoncr should achieve a net profit of RM229 million for cumulative 2 quarters 2020 which is historical new high too.

As i mentioned above, its operating profit actually increased by 16% meaning to say there isnt a change in company's fundamental. Any drop is a chance to collect.

Valuation wise, Aeoncr is currently trading at PE of 13 at the price of RM 14.96. Like i mentioned before, its fair PE is around 10 - 11. At PE 10, its share price is RM 11.5, at PE 11, its share price is RM 12.65. 


Sunday, September 22, 2019

Genting Malaysia Berhad in 2011 VS 2019


From the above chart we can see that Genm's share price has gone back to square one as at September 2010 & September 2011 as highlighted in purple square. So how is Genm financials today as compared to year 2011? 


Genm Financial in 2011 VS 2019
  1. In 2011, Genm achieved a revenue of RM 8.4 billion however in 2019 Genm is expected to exceed the RM10 billion threshold which could be the highest revenue in Genm history. (This revenue have not even factor in the contribution from the theme park that is going to open next year). 
  2. In 2011, Genm earnings before interest tax & amortization is RM 2.2 billion with a margin of 26.18%. In 2019, its EBITA is expected to be reach RM2.7 billion which is 20% higher than 2011. (I prefer to use EBITA as it reflects a better operation profit of Genm)
  3. Genm has grown its net tangible asset by 1.3 times from 2011 to 2019. Its price to book value in 2011 and 2019 is 1.37 and 0.97 respectively. (This means that in 2011, you are paying RM1.37 for an asset that worth RM1 however, in 2019, you are paying RM 0.97 for an asset that worth RM1. You do the math yourself to see which one is more worthwhile)
  4. Looking back at its historical PE for the past 5 years, Genm has always been trading between the PE of 15 - 20. Currently its PE is 13.2 which is quite close to year 2011 PE of 11.46. (If Genm goes back to its fair PE of 17.5, its share price will be RM 4.05).
  5. Return of Equity for Genm in 2011 & 2019 is 7.54 and 7.62 respectively which is not much different. However if you look at its return on invested capital in 2019, the company has actually uses its equity more effectively than year 2011 and 2018. (ROIC for 2019 is calculated based on assumptions for 2019 earnings of RM 2.7 billion). 
  6. Number of visitors that patron Genting in 2011 were 20.3 millions while in 2018, the number of visitors grew to 25.9 millions. A growth of 27.58% (Genm is definitely doing something right to achieve growing number of visitors every year).
  7. I did an assumption that there is no special dividend being payout in 2019, hence, it will be an interim dividend of 6 sen plus a final dividend of 5 sen, a total of 11sen of dividend in 2019. At the price of RM3.05, its dividend yield is 3.6% which is still higher than its dividend yield in 2011. 
  8. For those that have concern on the massive losses contributed by Empire Resort, for your information that contribution from US and Bahamas was negative back in 2011 and 8 years later in 2019, US and Bahamas has contributed earnings before interest tax & amortization of over RM300 million to Genm. Does the management has the ability to replicate this achievement in Empire Resort?


Saturday, September 21, 2019

Apex Healthcare Berhad (AR 2018)

Company Background


  • Apex Healthcare Berhad started off as a retail pharmacy called Apex Pharmacy in Melaka in 1962 and subsequently listed on the 2nd board of Bursa Malaysia in year 2000. After 3 years, Ahealth successfully transferred to the main board in 2003. 
    • Ahealth revenue grew from RM 259 million in 2008 to RM653 million in 2018 (2.52 times) 
    • Ahealth PBT grew from RM 19 million in 2008 to RM 69.3 million in 2018 (3.64 times)
    • Ahealth share price grew from RM 0.11 in 2008 to RM 1.9 in 2018 (17 times)
  • Ahealth is the largest pharmaceutical company by market capital in Malaysia which is close to RM1 Billion.
  • Ahealth has 3 main business segments:
    1. Develop, manufacture and market XEPA brand generic drugs and medical devices.
    2. Wholesale & distribution of pharmaceutical & healthcare products.
    3. Operating 60 outlets of Apex Pharmacy in Malaysia & Singapore and manufacture orthopedic devices, components and surgical instruments (e.g. screws, plates, implants, intra-medullary nails, pins, external fixators). Ahealth only venture into orthopaedic industry in 2013 through its 40% equity in Straits Apex Sdn bhd. 
  • Manufacturing of generic drugs contributes 61% of Ahealth profit before tax followed by wholesale business (33%) and orthopaedic & pharmacy operations (7%). 
  • Manufacturing of generic drugs has the highest profit margin which is 27%. Do take note that profit margin for orthopaedic & retail pharmacy operation improved from 5% in 2017 to 10% in 2018 mainly contributed by high profit margin in orthopaedic manufacturing (we will look into this later)
  • 68% of its revenue were from Malaysia, 30% from Singapore and 2% from Other countries. 


Financial Highlights
  1. Revenue and net profit grew at CAGR of 7.69% & 11.75% respectively from 2013 - 2018. 
  2. Gross profit margin is around 22% - 23% while net profit margin is around 7% - 8%.
  3. Ahealth has been consistently paying out around 30 - 40% of its profit as dividend over the 5 years. 
  4. Ahealth cash holding has grew from RM32 million in 2013 to RM81 million in 2018 and has no bank borrowings prior to 2018. In 2018, Ahealth incurred a bank borrowings of RM29 million mainly because of the expansion of SPP NOVO where Ahealth invested a whopping RM96.5 million in purchase of PPE in year 2017 & 2018. Even after investing RM96 million in SPP NOVO, Ahealth still remain as a net cash company with 0.44 sen of dividend per share. 
  5. Ahealth has been generating positive operating cash flow as well as positive free cash flow all these while. The reason that the free cash flow in 2018 was negative was due to the heavy investment in SPP NOVO for its next phase of growth. 
  6. Income tax rate for 2017: 20.62%, 2018: 15.30% mainly because of additional RM4.2 million of reinvestment allowance from SPP NOVO.   
  7.  Impairment from trade receivables were 2.06% in 2018 & 1.37% in 2017 was deemed to be very well managed. 
  8. From the above info we can conclude that Ahealth sales to the government sector and                          export market grew by more than 100%. Majority of its sales were to private sector in Malaysia 
      and Singapore as it dominates 87% of its revenue. 


Future Prospect
  1. SPP Novo is the third oral solid dosage facility with automation system in the Melaka Campus and is set to triple the production capability when it is in full operation. (In line with industry 4.0 concept)
  2. Ability to tender for large order book with its new SPP Novo. 
  3. In September 2017, Xepa Pattinson has been award with EU GMP certificate (achieving this license prove that Xepa brand medicines are of consistent high quality and meet the requirements of the marketing authorisation or clinical trial authorisation).  
  4. Investment of 40% in Straits Apex Sdn bhd which is going to be the next growth engine for Ahealth. Revenue and PAT of Straits Apex has been growing at CAGR of 23.24% and 52.71% respectively from 2014 - 2018. Its profit margin is also constantly improved over the 5 years as shown in the table below. (the growth rate is very insane)

  • Straits Apex secured a new customer and in the process of setting up facility and testing for the new customer in 1Q19. Notably, the contract manufacturer of surgical grade orthopaedic devices has managed to secure new customers as a result of the US-China trade tension as most of its customers are US multinational corporations (MNCs). 


Strength
  1. Strong balance sheet with proven track record on earning stability. 
  2. Ahealth is in the economic resilience industry as pharmaceutical products are needed regardless of economic conditions. 
  3. Government sector as at 2018 has only contributes 7% to Ahealth revenue, hence, there are more room to growth and the fact that 90% of its sales are to private sector meaning the earnings are more stable as it is not overly depending on single major client. 

Weakness
  1. Before the production capacity of SPP Nova being taken up by new orderbook, the depreciation and finance cost tend to drag Ahealth earnings lower. 


2019 Q2 Report


  1. Ahealth profit margin shrink slightly as compared to 2018 however overall, the company performance is still decent as its net profit margin is still within the range of 6% - 8%.
  2. Ahealth used to be a net cash company however in 2019 a RM700k of finance cost incurred due to the borrowings to built SPP Nova. The interest expenses is about 28% of its net profit. 
  3. Please take note that the contribution from its associates Straits Apex SB improved by 30%. Contribution from Straits Apex SB would become its next pillar of growth if its continue to grow at this speed. 
  1. Ahealth revenue for cumulative 2Q increased by RM13 mil (4.05%) however its receivables dropped RM2 mil (1.2%) and its borrowings dropped RM 2.8 mil (9.5%). Payable increased by RM9 mil (7.7%). [From this we can see the effectiveness of the management on handling the cash flow. Revenue  ⬆ but the money that the customers own Ahealth ⬇ while the money they own the supplilers ⬆. The money they own to the bank ⬇]

  1. 6 months depreciation of 2019 accounts for RM7 mil to Ahealth profit and loss account however, regarding of the high depreciation expenses results of SPP nova, its cash flow generated from its operation remain strong at RM39 million. 
  2. As we can see that Ahealth no longer need high capex for SPP Nova therefore the amount spend on PPE reduced by 60% which enable them to pair its debts down sooner than you can expected with its strong free cash flow. 
  3. Ahealth receive a government grant of RM6.7 mil in 2019 which contributes to their strong cash position too.   
  1. The company expect a satisfactory performance for 2019 and working to maximize the utilization rate of SPP Novo. 


Valuation @ RM2.19

  • At the price of RM 2.19, its PE is 18.3 which is at its highest over the 5 years period. EPS for 2019 expected to be lower than 2018, therefore it is unreasonable for Ahealth to have higher share price than 2018. 
  • Average PE for Ahealth is 14.5, therefore if the share price reach RM1.73 it would definitely be a good entry point for Ahealth. 
  • However please take note that if Ahealth successfully reduce its debts hence its interest expenses, with the additional capacity from SPP Novo and contribution from Straits Apex SB, Ahealth could easily pair down its PE by then. Therefore, 2019 will be a resting year for Ahealth before it continue to shines. 
  • Ahealth is never a dividend stock therefore i wont be valuing it with its DY.


Technical Analysis
Technically Ahealth is still in a downtrend however it has successfully break above its 200MA which means it could be at a short term bullish.  


Saturday, September 7, 2019

RCECAP Q1 2020

  1. Revenue increased by 5.8% while interest expense increased by 9.8%. 
  2. Allowances for impairment loss on receivables reduced by 28% which means the quality of the loan are improving. 
  3. Net profit improved by 3.9%. 
  1. Bank borrowings reduced by 8.8% hence gearing ratio further reduce from 1.91 to 1.81. This will reduce the interest expense of RCECAP and further strengthen its balance sheet.
  2. Loan and receivables grew by 1.5%. 

  • Nothing much being mentioned other than the group expect the company to be profitable. 


Comments
  1. Valuation of RCECAP at RM1.57
    • PE: 5.6 which is the lowest in the 5 years period considering the share price is at high. [undervalue]
    • CAGR from 2017 - 2019 is 5.54%, therefore at the PE of 5.6, its PEG ratio is 1.01 which is deemed to be fair.  If Rcecap dropped to RM1.5, its PEG ratio would be 0.97 which is undervalue. [undervalue]
    • DY: If the company do a dividend payout of 35% in 2020 or equivalent to 10 sen, its DY would be 6.4% (this is comparable to Maybank dividend yield) [undervalue]
    • NTA is RM1.65 which is higher than its share price of RM1.57. [undervalue]
    • Price to book value is currently 0.87 which means we are paying 0.87 sen for a company asset that worth RM1.[undervalue]
    • ROE is 15 which is 2 times higher than its PE. [undervalue]
    • RCECAP fair PE should be 7 to 8.  At PE 7 Rcecap is worth RM1.96. At PE 8, Rcecap is worth RM2.24.

Friday, September 6, 2019

Rce Capital Berhad (AR 2019)

Company Background

  • Rcecap is a subsidiary of Amcorp Group Berhad and involved in 3 business segment namely:
    • Consumer Financing - Provide personal financing to government employees where the repayment are done through a salary deduction scheme whereby the installment payments are deducted from salary of those participating employees on a monthly basis. (only focus on personal loan)
    • Commercial Financing - Factoring (business sells its accounts receivables at a discount to a factoring company which provides quick cash to the business) & Confirming  (business needs to confirm an order of goods and the confirming company undertakes to pay the supplier of goods upon delivery on behalf of the business).
    • Payroll collection - EXP’s collection service attends to deductions in payroll systems of government departments under the purview of Accountant General’s Department of Malaysia.
  • Rcecap derive its income mainly from consumer financing which accounts for 89% of its revenue in 2019. 
  • Minimum dividend payout ratio of 20% - 40% of its net profit. 

  • Rcecap is listed in 1994 and transfer to the main board in 2006 and introduce payroll collection business in 2014.


Financial Highlight

  1. We will focus its growth starting 2017 as RCECAP consolidate every 4 shares into 1 in 2017. Their NPL prior to 2017 is extremely high due to low quality of loan. However, the company started to focus on the quality of loan and consolidate its shares to make the company better. 
  2. CAGR on revenue and net profit from 2017 - 2019 was 5.54% and 6.56% respectively. 
  3. CAGR on EPS from 2017 - 2019 was 5.47% which is in line with its revenue and net profit growth.
  4. Dividend payout increase every year form 2017 - 2019 and in 2019 the company have a dividend payout ratio of 32%. (Bear in mind that the company is willing to share its profit up to 40% with its shareholder)
  5. Since it consolidate its shares in 2017 its ROE improved to 17% from below 10% which is on par with the ROE of Aeoncr. 
  6. Gross financing and net financing receivable grew at CAGR of 4% from 2017 - 2019 however its gearing ratio actually decreased. This means the company utilized its equity effectively. 
  7. Non performing loan also decreased to 4% since it consolidate its shares. 

  1. Its interest income grew steadily from 2016 to 2019. 
  2. Cost to income ratio improved from 31.2% to 22.2% in 2019 which is a big improvement in cost control. 


Future Prospect
  1. Remain focus in the niche market and bringing in quality loan remain as main priority to bring down the non performing loan. 


Strength
  1. Focus on quality loan from government servant where the salary will be auto deducted for payment to Rcecap before paying to the borrower. 
  2. Management team is willing to share its profit with its shareholder. Dividend payout in 2017: 3sen, 2018: 7sen, 2019: 9sen. Management is willing to share up to 40% of its profit with its shareholder. 
  3. Low gearing ratio which means there is more room for the company to take up more loan to expand its business. 
  4. Improvement in management effort to improve its cost to income ratio as well as to reduce its non performing loan. 

Weakness
  1. Limited business segment as the company only focus on personal loan of civil servant. 
  2. Unable to check  CCRIS from bank negara to ensure the debts payment background of the borrower however the salary of the civil servant will be deducted automatically to settle the loan before paying out to the borrowers. 

Valuation
  • 2017: Share price - RM1.69, EPS - 23.89sen, PE - 7.07
  • 2018: Share price - RM1.25, EPS - 26.02sen, PE - 4.80
  • 2019: Share price - RM1.63, EPS - 28.02sen, PE - 5.82
  • From the above comparison, we can see the its EPS grew 17% however its share price maintain at RM1.60. 
  • Assuming if  Rcecap distribute 10 sen of dividend in 2020, at the price of 1.55, its DY is 6.5%. 
  • Rcecap is worth PE of 7 - 8. At PE 7 Rcecap is worth RM1.96. At PE 8, Rcecap is worth RM2.24


Technical Analysis
  • Rcecap is currently trading below its short term and long term moving average and the next support is seen at 1.42. 


Sunday, September 1, 2019

YSPSAH Q2 2019

  1. Revenue increased by 3.5% however gross profit reduced 7.3% due to increase in raw material cost. Gross profit margin was 44.48% while profit before tax margin was 10.56% which is still acceptable. 🔻
  2. Selling, distribution and admin expenses increased by 10% which is higher as compare to revenue increase of 3.5%. 🔻
  3. Finance cost increased by 63% however this do not post as a threat to the company as the company have interest income to offset. =
  4. Net profit dropped by 35% mainly due to higher cost of goods sold, higher operating expenses, higher depreciation of RM 1.9 million and foreign exchange loss of RM 501K, last year there is a forex gain of RM 2.1 million as shown in the info below. Last year, the company spend RM 28 million on purchase of PPE, the higher depreciation expenses should derive from there.🔻 


  1. Although the profit of YSPSAH drops, however its net cash generated from operating activities increase thus increase its cash position to RM 0.39 sen per share. 🔺

  • The management were cautiously optimistic of its performance moving forward. =


Comments
  1. It is quite obvious that YSPSAH wont be able to achieve a higher net profit for 2019 as its current net profit cumulative 6 months is only 36% of 2018 profit. However, its cash flow still remain strong. 
  2. Valuation wise, YSPSAH is currently trading at RM 2.31, PE is 13, DY is 3.6%. PE 13 is deemed to be fairly value for YSPSAH. Assuming if the full year EPS is 18 sen for YSPSAH, at PE 10, YSPSAH is at RM1.8, its DY will be 4.7%.

Amway Q2 2019

  1. Revenue increased by 3.3% while gross profit increased by 18.6% as product buy up activities ahead of price increases effective mid-March and mid-April 2019. 
  2. Distribution and selling and admin expenses remain flat which is good. 
  3. Profit before tax increased by 83% due to higher sales and lower import cost primarily attributed to favorable foreign exchange impact.
  1. Operating cash flow generated from operating were RM 51 million for 6 month cumulative which accounts for full year operating cash flow for the past 3 years. 
  2. The company has a net cash of RM 198 million which equivalent to RM 1.21 net cash per share. 
  • Movement of USD/MYR for April, May & June 2019. Its average is around 4.15.


  1. The management is optimistic of Amway growth in 2019. 


Comments

  1. The net profit margin improved to 6.1% which is the highest level since 2016 as Amway increase their product price effective April 2019. This is something worth taking note as dividend payout ratio of Amway is 80% - 90%. Therefore, increase in EPS would lead to increase in dividend payout. 
  2. Assuming if the EPS for the year is 35 sen, 85% dividend payout would be 30 sen. At RM6 a share, its DY is 5%. 
  3. At RM6 a share, its PE is 14.4 which is the lowest in 5 years. As mention in my previous post, a reasonable PE for Amway is 18 - 20. Assuming Amway is able to achieve an EPS of 35 sen, At PE 18 Amway is worth RM6.30. At PE 20, Amway is worth RM7. 


Power Root Berhad (Annual Report 2019 & Q4 2020)

Company Background Pwroot is an instant drinks manufacturer with different brands to target different customers.  Ah Huat instan...