Sunday, July 26, 2020

Power Root Berhad (Annual Report 2019 & Q4 2020)

Company Background
  • Pwroot is an instant drinks manufacturer with different brands to target different customers. 
    • Ah Huat instant coffee is to target the Chinese market
    • Alicafe and Alitea with tongkak ali to target the Malay man Market (with Halal Certificate)
    • Pearl instant coffee with Kacip Fatimah (Kacip Fatimah is rich in phytoestrogen and isoflavones, that may ease menopausal symptoms) to target the Malay women market (with Halal Certificate)
    • Instant chocolate drink and Instant Ah Huat Tea Tarik to target the non-coffee drinkers. 
  • 57% of Pwroot shares are hold by its 4 major shareholders and 3 of them are founders of Pwroot. 
  • Worth to note that 95% of Pwroot shares are in the hands of long term shareholders (95% of Pwroot shares are owned by 5% of its shareholders. Based on closing price of RM2.10, the value owned by these group of shareholders are worth at least RM200k per shareholder.
  • Earnings in 2010 vs 2020:
    • In 2010, Pwroot revenue was RM153 million, net profit was RM10 million, share price was RM0.45
    • In 2020, Pwroot revenue was RM386 million, net profit was RM51 million, share price was RM1.92
    • Its revenue grew 153%, net profit grew 410% while share price grew 326% over the 10 years. 
  • Domestic vs Export earnings in 2010 vs 2020:
    • In 2010, Pwroot sales from Malaysia market (RM133 million) and Export market (RM20 million)
    • In 2020, Pwroot sales from Malaysia market (RM177 million) and Export market (RM208 million).
    • Sales from Malaysia market grew 33% while sales from Export market grew 940% over the 10 years (Can see that Pwroot focus more on overseas growth) 
  • Pwroot has 2 manufacturing plant in Johor (one factory for instant powder beverage and another one for canned drinks)
  • Pwroot set up distribution companies in China, Indonesia and United Arab Emirates. UAE being their main market for export sales. 


Financial Background
  • Gross profit margin of Pwroot is around 55%. 
  • Net profit margin of Pwroot is around 10% - 13%.
  • Reasons for a drop in net profit to RM9 million in 2018:
    • Unfavorable sales mix (high raw material cost, low GP margin)
    • Writing down of inventories (RM2.8 million)
    • Impairment loss on PPE (RM2.3 million) mainly resulting from writing down of the ground works done on our leased property for manufacturing plant in the UAE 
    • Foreign exchange losses (RM5.3 million).
  • Reasons for a drop in sales in 2019:
    • Spend less in advertisement and promotion (A&P) hence lower sales (RM40 million in 2019 as compared to RM74 million in 2018 spend in A&P). 
    • Saudi Arabian government required Saudi companies to replace foreign workers with Saudi nationals through a quota policy, and the effect of expatriate levies which led to a reduction in the consumer expatriate population who were major consumers of our products (Export sales dropped from RM204 million in 2018 to RM173 million in 2019)
  • Pwroot is generous in paying out its profit as dividend (80% - 100% of dividend payout ratio however company policy on dividend is 50% payout ratio)
  • Net cash companies with strong operating cash flow and free cash flow. 


  • Pwroot spend approximately 20% of its sales on advertisement and promotion for brand awareness. 
  • Low quality of trade receivables:
    • 19% of its trade receivables do not paid on time in 2018
    • 22% of its trade receivables do not paid on time in 2019
  • According to Ambank Investment report, Pwroot cash conversion cycle was around 83 days. 
      • Inventory days: 60 days (technically it took Pwroot 60 days before they sold their products)
      • Receivable days: 111 days (technically it took Pwroot 111 days before they manage to collect the money back from their debtors)
      • Payable days: 88 days (technically it took Pwroot 88 days before they pay their suppliers)


    Strength
    • Manage to target all races (Muslim and Chinese in particular) with different branding. 
    • Growth in overseas sales surpass the sales in Malaysia with UAE being its main contributor since 2019.


    Weakness


    Commodities that affects Pwroot Gross Profit Margin:
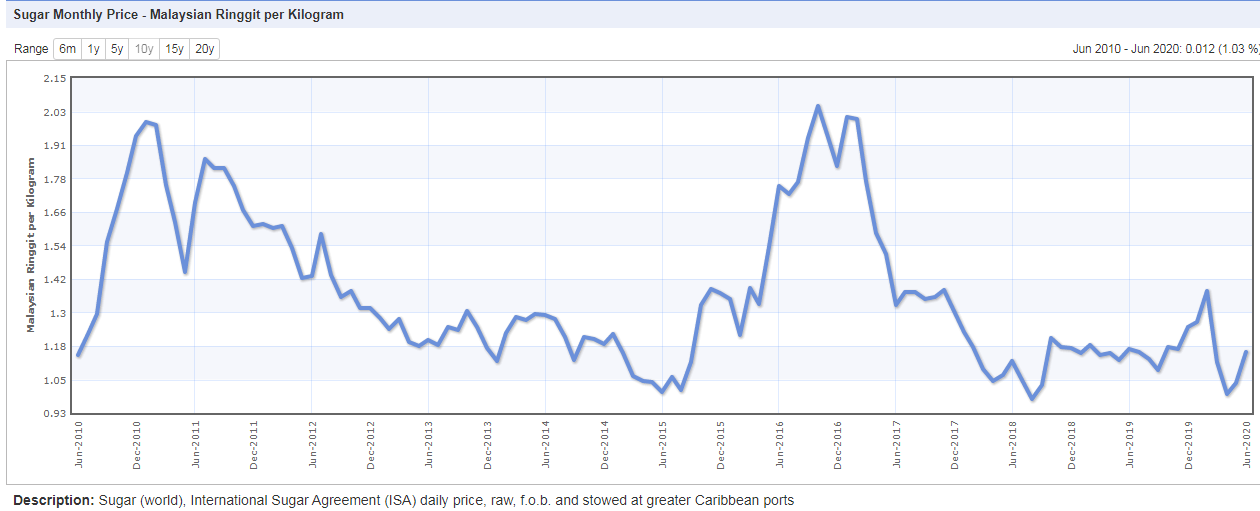
      • Sugar price are relatively low which is favorable for its gross profit margin
      • Arabica coffee beans price are on the rise which is unfavorable for Pwroot. 
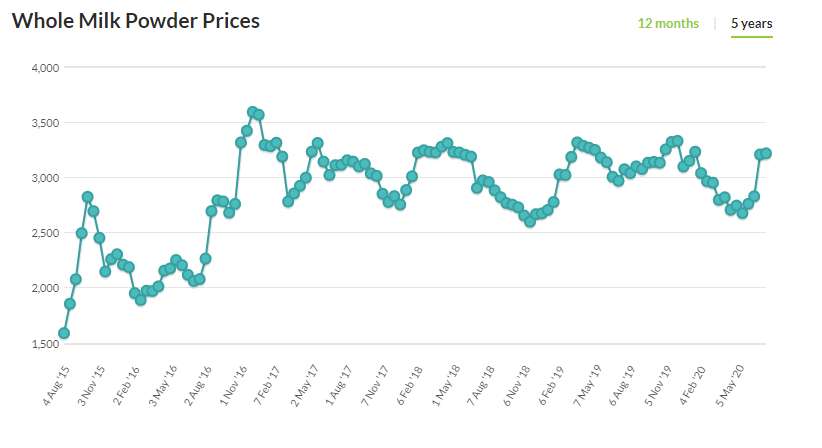
      • Milk prices are on the high side of consolidation. 


    Futures Prospects: 
    • Expansion of new factory at its current Johor facility which would double the production capacity. Capital expenditure estimated to be RM35 million. Expected to complete in 2022.
    • New distributor appointed in Egypt to tap into Egypt market. 
    • Focus on online sales
    • Expand product range such as cocoa and tea to increase the value chain.


    Peers to Peers Comparison
    • Both Oldtown and Super Group were privatized by PE firm JDW Asia in 2017 and 2016 at a PE of 24 for Oldtown and 30 for Super.


    Valuation of Pwroot @ RM2.10
    • Average PE of Pwroot is 18, at current share price of RM2.10, Pwroot is trading at a PE of 17 which is below its average. 
    • With dividend of 12.5 sen per share, Pwroot dividend yield is 5.95% which is 3 times higher than current FD rate. 
    • If Pwroot is to spend RM35 million to expand its production, in the short term, we might see higher depreciation and operating cost which will lower its profit in the short term. 
    • 65 millions warrants expire in 2023 remain un-exercise which is 15% of its existing number of shares. Expect to see further dilution in EPS. 


    Sunday, July 5, 2020

    Hong Leong Industries Berhad (AR2019)

    Company Background
    • 74.57% of shares owned by Hong Leong Manufacturing Group Sdn Bhd / Hong Leong Group while remaining 15% of shares are hold by fund house. Only 5% of shares are in the hand of retailers. 
    • Product & Services:
      • Consumer Products (Revenue: RM2,309 million, 85%):
        • Manufacture and distribution of Yamaha motorcycle
        • Manufacture and distribution of Ceramic Tiles with the brand Guocera
        • Distribution of Yamaha outboard motor products. 

      • Industrial Products (Revenue: RM418 million, 15%):
        • Manufacture and distribution of fibre cement board with the brand Primaboard and concrete roofing with the brand Hume Roofing.
    • 90% of revenue derived from Malaysia and 10% derived from overseas..  
    • HLIND owned 24% of shares in Yamaha Motor Vietnam Co Ltd which contributes RM90 millions of profit to HLIND in 2019 (That is around 18% of contribution to its PBT). Remaining 76% of the shares are owned by Vietnam Forest Corporation and Yamaha Motor Corporation. 


    Market Outlook for Motorcycle Industry
    • In 2019 demand for motorcycle industry in Malaysia increased by 16% due to Zero GST period in 2018 while in Vietnam the demand for motorcycle dropped by 0.3%. Nonetheless, motorcycle remain as the main transportation in Vietnam. 
    • Yamaha is the market leader in Malaysia motorcycle industry dominates 40% of Malaysia motorbike market followed by Honda (20%). 
    • However in Vietnam, Yamaha motorcycle merely dominates 20% of Vietnam motorcycle industry while Honda dominates 70% of motorcycle. According to UOB analyst report, Yamaha Vietnam expect to see a 5 % shrink in sales per annum from year 2019 - 2021. 
    • For more information on Malaysia Motorcycle market outlook and 2019 growth: https://www.motorcyclesdata.com/2020/02/05/malaysia-motorcycles/

    Financial Background
    • Revenue increased from RM2 billion in 2014 to RM2.7 billion in 2019, up 35%. 
    • Net profit increased from RM 207 million in 2014 to RM409 million in 2019, up 97%. 
    • Gross profit margin is around 18% - 20% while net profit margin is around 10% - 15%. 
    • Share of profit from associate are mainly affected by the sales of Yamaha motorbike in Vietnam. 
    • Dividend payout ratio is around 50% of its EPS. 
    • HLIND has strong operating cash flow and its free cash flow is always higher than its net profit. 

    • Motorcycle and marine outboard contributes 68% of its revenue followed by ceramic tiles, 16% and finally fibre cement and roofing, 16%.

    • Margin for consumer products improved consistency for 3 years to 17% in 2019
    • Industrial products remain a loss making segment for HLIND in 2019. 

    • Only 1% of its trade receivables past due the 90 days period. 


    Strength
    • Strong operating cash flow and balance sheet. 
    • Yamaha Motorbike is the market leader in Malaysia and ranked 2nd in Vietnam.  
    • Generous dividend payout. 
    • Motorcycle demand in 2019 is as high as 2013


    Weakness
    • Industrial product segment is a loss making segment which drag down HLIND profitability. 
    • Motorbike industry can be saturated however we may see operation efficiency whereby revenue merely increased by 36% while net profit increased by 96% over the 6 years. 

    Q3 2020
    • Revenue -12%
    • Net profit -26%
    • Share of profit from associate -76%
    • MCO implemented on 18 March 2020 which means 13% of the quarter are under movement control order which is identical to 12% of revenue drop. 
    • Balance sheet continue to improve where cash on hand increased from RM 1.04 billion in 2019 to RM 1.2 billion in Q3 2020. 


    Future Prospect


    Valuation of HLIND at RM8
    • HLIND is not a growth stock but a company with stable earnings, stable cash flow and generous dividend payout. 
    • The only way to make profit from HLIND is buy it at reasonable price and enjoy its consistent dividend payout. 
    • Due to the covid 19 impact, its annual EPS is 80 sen. A 50% payout at RM8 will have a dividend yield of 5%. 
    • Once the covid is over, its annual EPS would normalized to RM1. a 50% payout at RM8 will have a dividend yield of 6.2%. 
    • Share price has dropped 20% from RM10 before covid to account for a 20% impact on its financial which is fair and square for now. 


    Tuesday, June 30, 2020

    AEONCR Q1 2020

    • Revenue +1.8% : increase slightly or remain flat (consider pretty good as March, April and May is MCO)
    • Operating expenses +24.9% : due to higher impairment loss on receivable of RM174 million vs RM94 million in Q1 2020. An increase of RM80 million. 
    • Interest expenses + 22.6% : Bank borrowings increased by 19% while financing receivables increased by 15% as compared to Q1 2020 respectively. 
    • Profit after tax -68.9% : If addback the additional impairment of RM80 million, its net profit should be RM106 million which is higher than Q1 2020 of RM84 million. 


    Future Prospects
    • Overall, the management is bearish on the financial performance for 2021. 


    Analyst Report & AGM's Q&A
    • The higher than expected impairment loss on receivables is due to MCO. Will reverse the impairment in the future once the company successfully collect the receivables. 
    • MCO causes total financing volume to dropped drastically:
      • Personal financing -74%
      • Motorcycle financing -58%
      • Auto financing -60%
    • Nonetheless, non-performing loan remain low at 1.42%, dropped from 1.92% in 2020.
    • Management expect impairment loss for Q1 2021 to be the peak. 
    • Asset quality remain stable with collection ratio returning back to 70% - 80% of prior covid. 
    • Loan application rate in June has returning back to 80% of prior covid. 


    Valuation of Aeoncr @ RM9.50
    • Without a doubt that Aeoncr earnings in Q1 2021 is the weakest in the past five years with earning per share of 10.3 sen only. 
    • Management is bearish towards its earning for year 2021 in futures prospect. Expecting 2021 revenue and profit continue to shrink along its EPS.
    • Lower EPS also translate into lower dividend yield as Aeoncr usually pays 30% - 40% of it EPS as dividend. 
    • Although the management mention that its impairment loss is peak in Q1 2021 however to me there are still uncertainty to it, need to further monitor in the next Q to verify. 
    • If the next 3 Q's earning remain weak with high impairment loss on receivables, the current price for Aeoncr is pretty fair. 
    • However, if we do see a lower impairment loss moving forward, the target price of Aeoncr would adjust upward accordingly too.
    • Overall, to me the core business of Aeoncr remain intact where its NPL is low at 1.42% and asset quality remain stable. Impairment loss on receivable doesnt equal bad debts, therefore, any reversal will boost Aeoncr earnings in the future. 

    Sunday, June 28, 2020

    Revenue Group Berhad vs GHL System Berhad

    Company Background

    Revenue Group Berhad
    1. Listed on KLSE ace market in July 2018 for RM0.37:
      • Revenue and net profit for 2017 is RM25 million and RM7 million respectively. Share price is RM0.37.
      • Revenue and net profit for 2019 is RM58 million and RM9 million respectively. Share price is RM0.90.
      • Its revenue grew 132%, net profit grew 28%, share price increased 143%
    2. Products and services: 
      • Sales of EDC (Electronic Data Capture) Terminals and spare parts [Revenue: RM21 million, 37%].
      • Monthly rental/maintenance income of renting and maintaining EDC Terminals [Revenue: RM13 million, 21%]
      • Electronic Transaction Processing - net merchant discount rate (Net MDR) or commission earned from processing electronic transaction via the EDC Terminal and e-commerce (Net MDR earned as third party payment processor or master merchant) [Revenue: RM19 million, 34%].  
      • Solution & Services related to payment infrastructure:- commission earned on digital payment via e-commerce website, phone/utilities bill payment, game credits and etc [Revenue: RM3 million, 6%]
    3. 99.9% of their business are in Malaysia.
    4. 4 customers contributes 65% of its total revenue. 
    5. Director remuneration in 2019 is RM2.7 million [Revenue: RM58 million, net profit: RM9 million]


    GHL Systems Berhad
    1. Listed on KLSE in 2003: 
      • In 2009, its revenue is RM57 million, net loss is RM6 million, share price is RM0.37
      • In 2019, its revenue is RM347 million, net profit is RM28 million, share price is RM1.67
      • Its revenue grew 508% while profit grew 566%. Share price increased by 352%
    2. Products and services: 
      • Transaction payment acquisition such as MyDebit payment, supporting e-wallet payment, internet payment solutions etc [Revenue: RM204 million, 60%]
      • Sales or rental of EDC terminals [Revenue: RM131 million, 37%]
      • Solution services such as consumer loyalty program, prepaid e wallet solution etc [Revenue: RM11.9 million, 3%]
    3. Malaysia contributes 78% of their business followed by Philippines 13%, Thailand 8% and others 1%. 
    4. No single customer contributes more than 10% of its revenue. 
    5. Director remuneration in 2019 is RM2.1 million [Revenue: 347 million, net profit: RM27 million]


    Financial Backgrounds
    • Revenue's operating cash flow is low at RM2 million due to higher settlement on trade payable and increase in trade receivables. 


    Future Prospect

    Revenue Group Berhad
    • Expand to Myanmar and Cambodia partner with local financial institution (no company set up in Myanmar and Cambodia yet).
    • In March 2019, Revenue acquire 70% in Buymall and 51% in AnyPay which contributes RM300k and RM150k of net profit to Revenue for 6 months. 
    • For more information on how Buymall and Anypay will compliment Revenue business:  https://www.theedgemarkets.com/article/revenue-group-looks-beyond-payment-solutions  
    • Opportunity to transfer to main board as Revenue has meet the RM20 million PAT requirement (2018 + 2019 + 2020). 

    GHL System Berhad
    • Expand to Indonesia and Cambodia - acquiring 51% into Speed Pay PLC in Cambodia for RM8.4 million in 2019. SpeedPay commence operation and has a net loss of RM1.5 million in 2017. 
    • PT Pembayaran Elektronik Indonesia partner with Bank of Indonesia in February 2019 on transaction payment acquisition. 


    Valuation 
    • Revenue Group Berhad: Average PE for REVENUE is 30. Based on its current EPS of 2.8 sen, at PE30, Revenue fair price should be RM0.84

    • GHL System Berhad: Average PE for GHLSYS is 47. Based on its current EPS of 3.19, at PE47, GHYSYS fair price should be RM1.49

     * Covid 19 has impacted the business model of REVENUE and GHLSYS significantly as consumers are unable to spend in shopping mall causing earnings from transaction processing segment to drop. Therefore a discount of 20% on fair price should seen reasonable. 

    Sunday, June 14, 2020

    GENM 2019 Annual Report & Q1 2020

    Highlight of 2019 Annual Report
    • Overall, business across all sectors posted a positive growth in 2019 except gaming sector with a decrease of RM103 million / 0.01%  due to reduction in incentives offered to the players as part of the cost rationalisation initiatives.
    • Its EBITA margin dropped from 31% to 27% in 2019 in Malaysia mainly because of the increase in casino duty. However, overall business remain intact with EBITA of RM2554 million in 2019 despite higher casino duty while revenue grew by 6.6%.
    • Number of visitors that visited Genting Highland were record high at 28.7 millions visitor in 2019. 


    Concern of Genm moving forward
    1. Share of result in associate (Empire Resort): In 2019 Q4, Genm recognize a loss of RM31.6 million from Empire Resort (Assuming if Empire Resort posted the same losses per quarter, RM31.6 x 4 = RM126.4 million in 2020)
    2. Rising of finance cost and its gearing ratio:
      •  2017: Finance cost = RM115 million, Gearing ratio = 0.05 times
      •  2018: Finance cost = RM156 million, Gearing ratio = 0.09 times
      •  2019: Finance cost = RM250 million, Gearing ratio = 0.19 times
      • Nonetheless, its balance sheet remain strong with cash of RM6,529 million, Net Operating cash flow of RM2,577 million, borrowings due in less than 1 year amounting RM1,524 million and administrative expenses of RM780 million.
    3. Suspended operations at RWG, Resorts World Awana, Resorts World Kijal and Resorts World Langkawi since 18 March 2020 in compliance with the Movement Control Order announced by the Prime Minister. Similarly, as required by the respective authorities, RWNYC, RWC, RW Bimini, Resorts World Birmingham and the Group’s other land-based casinos in the UK are also temporarily closed to curb the spread of COVID-19.


    Future Prospect

    Malaysia:
      • Opening of theme-park will be further delayed until Q4 2021. 
    UK:
      • Rebranded online business as ‘GentingBet’ in addition to launching a new website with exclusive content.
      • Embarked on vertical integration in the online gaming space by acquiring Authentic Gaming Limited (“Authentic Gaming”), an online gaming specialist, to expand the Group’s offering through the utilisation of Authentic Gaming’s innovative streaming technologies to bring together its offline and online gaming experiences.
    US: 
      • Resorts World Casino New York City (“RWNYC”) maintained its market leading position by gaming revenue in the Northeast US region and the expansion of 400 rooms hotel is expected to open in second half of 2020. 
      • Empire Resort gaming revenues registering a 33% increase in December 2019. 


    GENM Q1 2020
    • Revenue was lower by 36% due to lockdown of 12 days in March. 
    • Lower other income recorded in Q1 2020 as there is one off disposal gain of UK subsidiary amounting RM124 million in Q1 2019. 
    • Higher impairment loss in Q1 2020 in view of the impact of Coronavirus Disease 2019 (“COVID19”) on the business activities, in accordance with MFRS 136 “Impairment of Assets”. 
      • An impairment loss of RM223.3 million relating to the assets of Resorts World Birmingham
      • An impairment loss of RM56.5 million relating to certain casino licences and assets in the United Kingdom
      • An impairment loss of RM66.5 million relating to the assets of Resorts World Bimini
    • Finance cost continue to increase with higher borrowings. Gearing ratio increase from 0.19 to 0.25 in Q1 2020. 
    • Losses incurred were RM100 millions on Empire Resort mainly due to the share of costs associated with the refinancing of Empire’s loans.
    • EBITA for Q1 2020 were RM355 million as compared to RM684 mmillion in Q1 2019. A dropped of  48%. 


    Future Prospect
    • Impact on Genm is very big as all its operation in Malaysia, US and UK were halted due to Covid 19. 
    • Losses on Empire Resort can be bigger than expected. If RM100 million x 4 = RM400 million which is equivalent to 30% of 2019 net profit.  


    Valuation of GENM at RM2.60
    1. In 2019, Revenue = RM10,406 million, EBITA = RM2,554 million, Share price = RM3.03
    2. As Genm operations in Malaysia unable to operate from 18 March 2020 - 31 August 2020 which is approximately 6 months. Lets discount its earnings and share price by half + an additional 15% for consumer sentiment to pick up. If discounting share price by 50%, Genm should worth RM1.50, if discounting share price by 65%, Genm should worth RM1.1. So RM1.1 - RM1.5 should serve as the rock bottom price for Genm to factor in the full impact of covid 19 on Genm financial.
    3. I do not expect Genm to pay any special dividend in 2020, assuming a 50% dividend cut on its interim and final dividend, Genm will pay a total of 5.5 sen. At the price of RM2.6, its DY is 2.1%
    4. Market is always irrational. Any price that we buy into above RM 1.1 - RM1.5, we would need to ensure that we have sufficient money to average down if necessary. 


    Monday, June 8, 2020

    FPI 2019 Annual Report & Q1 2020

    Highlights in FPI 2019 Annual Report
    • Revenue increased by 37%, EBITA incrased by 26%, net profit increased by 14% (Increase in revenue mainly due to increase sales to its holding company: Wistron Group. Lower net profit due to higher ITDA)
    • Inventories turnover days = 23 days to sell its inventory upon receiving it from suppliers
      Receivable / debtors turnover days = 49 days to collect money from customers after billing them
      Payable / creditors turnover days = 64 days to pay its suppliers after being billed by them
      Cash Conversion Cycle days = 23 + 49 - 64 = 8 days.   
    • Strong cash flow from operating of RM 71 million which is 173% of its net profit. 
    • In 2019 FPI only spend RM 9 million on purchase of PPE as compared to RM 20 million in 2018. This could further strengthen FPI balance sheet.                                                                                              
    • Forex gain in 2019 amounting to RM 7 million which accounts for 13% of its net profit. Excluding the forex gain, FPI net profit is RM 34 million where the profit margin is about 4.5%. 

    • Sales to Customer A (Sony) in 2018 - RM 256 million, 2019 - RM 263 million
    • Sales to Customer B (Roland) in 2018 - RM 109 million, 2019 - RM 150 million
    • Sales to Customer C (Wistron) in 2018 - Nil, 2019 - RM 189 million

    • 56% of its trade receivables are in USD while remaining in MYR. 
    • Only 0.5% of their receivables have chances of becoming bad debts. 

    • Only 32% of their payable is denominated in USD and 62% in MYR. 
    • This could probably explain the high forex gain for FPI. A stronger USD is beneficial to FPI. As they sell most of their products in USD but pay most of their supplier in MYR.


    FPI Q1 2020
    • Q1 always serves as the weakest quarter for FPI and Q3 the strongest due to christmas and new year sales. 
    • Revenue reduced by 13% however profit reduced by 30% due to lower sales volume as the Group shut down its operations from 18 March 2020 in compliance with the MCO. (one quarter has 90 days, MCO close down for 12 days  = 13% drop in sales is in line with the drop in revenue. Fixed cost remain the same which causes its net profit to drop 30%)
    • Higher other income in Q1 2020 most likely due to a forex gain of RM 3.2 million. If exclude the forex gain, its net profit would likely be somewhere around RM 2 million (its EBITA is RM10 million for Q1 2020)


    • Sales to Wistron grew by 100% as compared to previous year (this is something good). 

    • Expect the performance 2020 to be impacted. 


    Valuation of FPI at RM1.36
    • At the price of RM1.36 with EPS of 15.84 sen , current PE of FPI is 8.59 times. 
    • Assuming a 30% drop in EPS for 2021, Its estimated EPS for 2021 is 11.76 sen. 
    • Average PE of FPI from 2016 - 2019 is 9.5 times. PE of 9.5 with EPS of 11.76 sen, its share price with margin of safety should be RM1.12
    • FPI paid out around 65% of its earnings as dividend in the past 2 years. Assuming a 7.5 sen of dividend payout for 2020, its dividend yield is 5.5% based on its current share price of RM1.36. 

    Saturday, June 6, 2020

    Aeoncr 2020 Annual Report


    • Revenue increased by 17% with financing receivables increased by 19%.
    • Net profit dropped by 17% due to higher impairment loss on financing receivables. In 2020, Aeoncr recognized an additional RM142 million of impairment as compared to 2019. 
    • Operating profit before working capital changes were actually higher in 2020 at RM 1228 million compared to RM 1068 million in 2019. 
    • NPL stood at 1.92% for 2020.
    • Drop in dividend per share in 2020 is due to lower EPS caused by higher impairment loss. Dividend payout ratio remain the same as 2019 which is approximately 34%. 

    • On average, Aeoncr is charging 17.09% of interest to their borrowers. 

    • However, Aeoncr only paid an average of 3% - 4.5% of interest to the bank to secure their fund. 

    • 2.5% of their finance receivable portfolio failed to pay their loan within 30 days (Stage 1). 
    • 1.7% of their finance receivable portfolio failed to pay their loan within 90 days (Stage 2). 
    • 2.3% of their finance receivable portfolio failed to pay their loan for over 90 days (Stage 3). 
    • Non Performing Loan for Aeoncr in 2020 is 1.92% meaning to say they are still able to collect 20% of their money back under Stage 3 customers. 

    • Revenue contributed by each segment from 2018 - 2019


    Future Prospect
    • GDP growth for Malaysia in 2021 expected to be 0.5% to -2%.
    • Focus on three strategic business drivers: digitization, regionalisation and operational efficiency.
    • Leveraging on FinTech, AEON Credit aims to progressively transition to a lower-cost business model.  Offering retail financing solutions online is the future for AEON Credit, similar to other financial service providers.
    • Through digitization, the Company is looking at tapping into the rural and semi rural market.


    Valuation of Aeoncr at RM10
    • Average PE of Aeoncr from 2015 - 2020 is 9.5 times. At the price of RM10, its PE is 9.3 which is below its average PE. 
    • Aeoncr paid a dividend of 36 sen in 2020 which translate into 3.6% at the price of RM10. Historically its DY is always around 3% or below hence a 3.6% yield is consider above its average. 
    • Price to book value is now 1.45 times which is above its average of 1.11 times. 
    • In 2020, its EPS shrink 21% as compared to 2019 however its share price shrink 45% which means the price drop is greater than its drop in earning. 
    • Assuming a 20% drop in EPS in 2021, at PE 9.5, Aeoncr is worth RM8.2 (9.5 x 86 sen).
    • Assuming a 10% drop in EPS in 2021, at PE9.5, Aeoncr is worth RM9.2 (9.5 x 97sen).


    Power Root Berhad (Annual Report 2019 & Q4 2020)

    Company Background Pwroot is an instant drinks manufacturer with different brands to target different customers.  Ah Huat instan...