Friday, June 7, 2019

Elsoft Research Berhad (AR 2018)

Corporate Profile
  • Elsoft Research berhad had 4 main subsidiary being STSB, ESSB, LESO and BHSB. (Althought Elsoft is a tech company but it also invest in a butterfly farm in penang. Its Butterfly House Sdn Bhd (BHSB) made a losses of RM 1.22 million in 2018 and RM 0.98 million in 2019).
  • Elsoft Research Berhad is a leading provider of LED test and burn in system. It provides cost effective automated test equipment (ATE) to semiconductor, optoelectronic and automation industries. Its key product are test and burn-in systems used by its customers who manufacture optoelectronic devices such as LED, image sensors and automotive lightings to test their products before launching into the market.
  • Elsoft business can be categorized as below:-
    • Selling of automated LED test equipment (test equipment to check LED for automobiles and smartphones)
    • LED tester and LED burn in system (test system to check the lighting features of smartphones and automobiles)
    • Industrial IO board
    • Solar cell tester
    • Embedded controller for medical device (to be launched by end of 2019 or early 2020)
  • The smart device contributes 68.7% of its revenue followed by general lighting (14.6%) and automotive (13%).
  • 65% of Elsoft's staffs are engineers. This means the minimum wage scheme will not impact the company and shows that the company is heavily invested in R&D. 


Financial Highlight
  1. Elsoft's revenue, PBT and net profit grew at CAGR of 20.75%, 23.52% and 24.22% respectively from 2013 - 2018. ( This is due to high demand from smart devices industry over the years as well as most cars nowadays are switching to LED lights). 
  2. Elsoft has very high gross profit margin and net profit margin (> 50%) which i think is because they invent (original manufacture design, ODM) their own automated testing equipment for LED (this is their main competitive advantage. Elsoft do not push their product or services by participating in price war)
  3. Elsoft has been consistently reinvest approximately 20% - 25% of their net profit or 10% of their revenue in research and development over the years which is consider fair for a technology company. 
  4. Elsoft has a dividend payout policy of 40% of its net profit however, it has been consistently distributing more than 70% of its profit to its shareholder since 2015, which is double of what it promised (this showing that the management is willing to share its profit with its shareholder)
  5.  ROE were more than 25% since 2014 and reach its peak of 35% in 2018 (Economies of scale with large scale production during the year had improved the overall product margin hence improved their return to equity
  6. Elsoft is a net cash company with zero borrowings. Its net cash per share was 11 sen (Its share price is currently RM 0.805 where 11 sen of it were cash).
  7. From its operating cash flow from 2013 - 2018, we can see that Elsoft is able to convert most of its net profit into cash. 

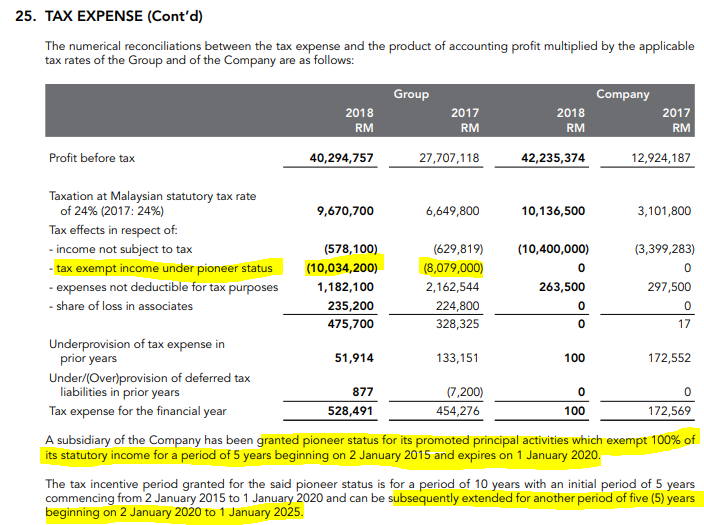
  • Elsoft's subsidiary (Elsoft System Sdn Bhd) enjoy tax exemption  of 100% under pioneer status until January 2025. This allows the company to save RM 10 millions of income tax (Elsoft paid RM 528k of income tax for its PBT of RM 40 million, this translate into 1.3% of income tax rate).
  • Elsoft derive its revenue mainly from Malaysia (85%) followed by China (13%). 
  • One of its major customer contributes RM 58 million or 75% of its total revenue however the management indicated that they have been working with this major client (lighting solution MNC) for more than 15 years indicates a long term and stable business relationship. 


Future Prospect
  • According to publication released by Semiconductor Trade Statistic the demand for semiconductor was up 13.7% in 2018 and expected to slow down by 3% in 2019 and to pick up again in 2020.
  • The above data is in line with Elsoft earnings as the demand weaken for the beginning of 2019 and expected to pick up during 2nd half of 2019. Maybe to recover in 2020.
  • Moving foward, Elsoft's R&D will be focusing on 
    • (a) ATE for infrared/laser devices testing 
    • (b) Next generation ATE for smart devices industry (LED flash tester catered to a major smartphone brand’s upcoming product line)
    • (c) New ATE for automotive industry (headlamp tester - developing a new range of test equipment to test multi-beam digital headlights that are replacing single-beam LED headlights operating on a rotating mechanical system for the automotive industry.)
  • Elsoft is also diversifying into embedded controller for medical device industry in 2019 which expect to be out in late 2019/ early 2020(however, this wont contributes significantly to the company to begin with).


As at Q1 2019
  • Gross profit margin dropped to 49% for the first quarter as compared to 58% in 2018. 
  • The business dropped 40% due to lower demand for automated test equipment (ATE) which is same as what 2018 annual report mentioned (i am expecting the 2nd quarter 2019 to be bad as well).
  • Although the business in Malaysia dropped 64% but the company has expanded further into overseas market. 
    • China contributes RM 3 million of revenue for Q1 2019 vs RM 10 million for 2018.  
    • Other countries contributes RM 1.1 million for Q1 2019 vs Rm 928k for 2018. 

  • The management didn't reveal much on its prospect however i think it is quite hard for 2019 to be a performing year. 
  • According to the analyst from TA Research, the company currently has an order book of RM 20 million (This only translate to 25% of 2018 revenue).  


Strength
  • High profit margin proving the company's strength in R&D (highest profit margin in the industry). 
  • Reliable management as the company is willing to share 80% of its profit with its shareholders although the dividend payout policy is only 40%. 
  • Elsoft never has a loss making quarter since 2009 and never fail to payout dividend since 2009. 
  • Enjoy low income tax rate due to pioneer status until 2025.


Weakness
  • Elsoft earnings is over dependent on one major customer. Therefore, when the customer's business slows down, it will directly impacted the company's earning. 
  • Customers are mainly in Malaysia (Elsoft should explore more into overseas market).
  • According to its 2018 AGM, its current factory utilization rate is merely 50% only as its major customer business slows down due to trade war. 


Valuation @ RM 0.805
  • From the above info, we can see that Elsoft's EPS started to go downhill after reaching a peak of 2.06 sen in Q3 2018 due to the uncertainty in trade war. Its latest quarter's EPS further deteriorate to 0.73 sen and expected to be slower for Q2 2019 according to the management prospect in 2018 annual report and will only recover slightly in 2nd half of 2019. 
  • Assuming if Elsoft generates EPS of 1.5 sen for the first half of 2019 and EPS of 2.5 sen for 2nd half of 2019, Elsoft would have a total of EPS of 4 sen for FY 2019. At current price of RM 0.805, its PE will be 20 which is deemed to be fairly valued. 
  • Elsoft have a history of dividend payout ratio of approximately 75% and this translates into a dividend pay out of 3 sen for FY 2019. At current price of RM 0.805, its DY is 3.7%. 
  • I will just use the average PE of 16 to value Elsoft. Assuming a 4 sen of EPS full year, at PE 16, Elsoft is worth RM 0.64 and its DY will be 4.6%. So anything below RM 0.64, there will be a margin of safety. 


Technical Analysis


Elsoft is currently trading in a downtrend and has break below its trend-line at 0.83. Short term traders are advice to enter above 0.83. 


Saturday, June 1, 2019

Aeon Credit Service (M) Berhad ( AR 2019)

Corporate Profile


  • Listed on Kuala Lumpur Stock Exchange on 2007. 
    • In 2009, its revenue and net profit were RM 146 million and RM 48 million respectively. Share price after the bonus issue is RM 1.30
    • In 2019, its revenue and net profit were RM 1,365 million and RM 354 million respectively. Share price after the bonus issue is RM 16.30
    • Its revenue grew approximately 9 times while its profit grew approximately 7 times over the 10 years. Share price increased by 12 times over the 10 years. 
  • Aeoncr has won "highest return on equity over 3 years", "highest growth in profit before tax over 3 years" continuously for year 2015 , 2016 , 2017 , 2018 for the edge award for financial service sector under RM 10 billion market capital. (This has proven that Aeoncr has consistency create values for its shareholders over the past 5 years)
  • From the above cover page of 2019 annual report, we can see that Aeoncr is currently focusing on its cashless wallet to join the trend of e-wallet (i am not too sure how will this benefit Aeoncr greatly)
  • Prior to 2018, the market segment that Aeoncr target is always the low income customers. However in 2018, they Launched AEON Platinum credit card (Visa and MasterCard) which is targeting at middle income customers. The minimum salary to apply for the card is RM 60,000 per annum. (this segment of customer usually has lower default risk in my opinion)
  • Aeoncr also successfully obtain money lending license valid for 2 years ended in Jan 2021 (I believe Aeoncr can renew this license after that). This license enable Aeoncr to undertake any business of those relating to the money lending activities which complements its existing business. (i believe this can be another growth phase for Aeoncr)
  • As at 2019, Aeoncr has 4.6 million of card members, 12,000 merchant outlet nationwide and 71 branches and service center. 
  • From the above info, we can see that Aeoncr derive its income from mainly car financing (30%) followed by motorcycle financing (28%) and personal financing (26%). Financing on motor vehicle and personal financing constitute 85% of its income. (People who failed to get a loan from the bank will usually approach Aeoncr for their loan). 
  • Aeoncr derive its main income from micro-financing.
  • 62.59% of its shares are hold by its mother company AEON FINANCIAL SERVICE CO. LTD. with the rest of its top 30 shareholders being foreign fund. 


Financial Highlight
  1. Revenue and net profit of Aeoncr grew at CAGR of 12% from 2014 - 2019 which is amazing as it beats the bank's performance. 
  2. The number of shares grew 78% due to RCULS conversion which causes its EPS to drop 23% from 2017 - 2019. Without the additional shares, Aeoncr actually did very well as its net profit grew 33% from 2017 - 2019.
  3. Dividend payout ratio stood at approximately 30 - 35%. 
  4. Gross financing receivables are the amount that Aeconcr borrowed out and yet to collect back. As you can see that its gross financing receivables and net financing receivables grew by CAGR of 16% and 14% respectively (meaning to say, the business become bigger). 
  5. Aeoncr achieved the lowest NPL over the 6 years which is only 2.04%.
  6. Its PEG ratio workout to be 0.91.


Future Prospect
  • Aeoncr will roll out the Robotic Process Automation and Biometric Identification which will benefit the Company in our operations and offer greater convenience to our customers.
  • Launched e-wallet in November 2018 (however i dont see its e-wallet being popular yet and not sure how it can help Aeoncr to make money?).
  • Trying to increase their middle income customer as currently 70% of their customers are the B40(low income group). 
  • Continue to strengthen its customers’ loyalty through the continuous introduction of new loyalty programmes and benefits.
  • Slowly move to B2B from B2C after obtaining the money lending license. 


Strength
  • It is difficult for low income group to get loan from the bank therefore, they will turn to Aeoncr for their loan. However, Aeoncr would need to make sure the quality of their customer to minimize the default risk. 
  • Strong management team as proven in the past 10 years (It is worth taking note that their NPL is only 2.04% which is even lower than CIMB of 2.91% and Maybank of 2.41%. Aeoncr customers' risk are usually higher than the conventional bank as they charge a higher interest rate for this default risk. However they are able to manage the risk to 2% is something worth praising)
  • Strong balance sheet with high ROE.


Weakness
  • Low dividend yield. 
  • There will be further EPS dilution as there are more ICULS to be converted. 


Valuation @ RM 16.10
  • At RM 16.10, its PE is 11.39 which is consider as its peak and its DY is only 2.77% which is below the 3% monthly FD rate. 
  • A fair PE for Aeoncr would be somewhere around 10. Assuming if its EPS remain flat due to further ICULS conversion for 2020, at PE 10, its share price is RM 13.58 and its DY would be 3.3%. 
  • At DY of 3%, its share price is RM 14.80. 


Technical Analysis

Aeoncr has been trading below its trendline for quite sometime however it is still well supported by its 200MA. Its 20MA is approaching to cross below its 200MA signifying the start of a downtrend if it happens. 

Friday, May 31, 2019

Amway Q1 2019

  • Gross profit margin and net profit margin of Amway shrink further to 23.81% and 4.29% from 24.71% and 5.61% respectively in 2018. 
  • Distribution, selling and administration expenses accounts for 18.6% in Q1 2019 as compared to 18.17% in 2018. 
  • From the above chart, we can see that USD/MYR dropped from January, February and March 2019 but still the margin of Amway shrink as compared to previous quarter? (not too sure about Amway hedging policy on USD). The average USD/MYR rate for Jan - Mar 2019 is 4.07
  • The management is optimistic that the sales will continue to grow as the management mentioned that they will increase their selling price effective March 2019. However, the profit margin might be under pressure due to unfavorable USD rate. 

Comments

For the moment, there is no sign of recovery for Amway yet as their gross profit margin is below its benchmark of 24.5%. USD is on the rise as well. Hopefully the increase in product price will mitigate their cost of import however will it be harder for its ABO to sales their product as it becomes more expensive? 

At current price RM 5.83, its PE is 16.77 which is the lowest since 2014 and its DY is 4.72%. Amway achieve an EPS of 6.5 sen for the quarter, assuming if Amway generates an EPS of 28 sen for 2019, at PE 18 - Amway is worth RM 5.04, at PE 20 - Amway is worth RM 5.60. 


Thursday, May 30, 2019

YSPSAH Q1 2019

  • Gross profit margin for Q1 2019 is 43% which is reasonable however is below its benchmark as previously its gross profit margin always range from 44% - 47%. 
  • Selling, distribution and admin expenses accounts for 31.71% in Q1 2019 vs 31.43% in 2018. 
  •  Profit before tax margin stood at 9.36% in Q1 2019 which is lower than its benchmark. From year 2013 - 2018, YSPSAH manage to achieve a PBT margin of more than 11%. 
  • Net profit margin shrink to 6.62% which is below its benchmark of 7% - 11%.
  • Overall, the main reason for the drop is due to lower gross profit margin. 

  • YSPSAH has a net cash per share of RM 0.30 increased from RM 0.27 previously. Borrowings decreased from RM 39 million as per 2018 annual report to RM 34 million for the current quarter. 
  • The main reason for the business to slow down is due to lower overseas sales and lower profit margin for the current quarter. 
  • Overall, the management is positive with its performance for 2019. 
  • The company is working on improving efficiency, increase product offering and promotion to increase market shares. 

Comments
Overall, the company perform slightly below benchmark for the current quarter due to higher cost of sales. Nevertheless, the demand for pharmaceutical products will always be there regarding how the economic perform. It is worth waiting for another 2 more quarters to find out how the company will generally perform in year 2019. At the price of RM 2.44, its PE is 11.9, ROE is 8.90, profit margin slide to 6.5%, DY is 3.48%.


Saturday, May 25, 2019

Genm Q1 2019


  1. Gross profit margin stood at 24.93% which is slightly lower than its 2018 gross profit margin of 26.82%.
  2. Other income stood at RM 193 million in Q1 2019 which accounts 40% of 2018 other income of RM 483 million mainly due to recognition of a gain of RM 123.8 million from the disposal of a subsidiary in UK.
  3. Other expenses increased by 83% mainly due to provision of related costs as a result of the termination of contracts related to the outdoor theme park at Resorts World Genting of RM 198.3 million.
  4. Genm incurred an impairment loss of RM 17 million in Q1 2019 which is quite normal as in 2017 Genm has an impairment loss of RM 54 million. 
  5. Finance cost accounts for 26% of Genm net profit which is still manageable and their gearing ratio is currently 10% as compared to 9% in 2018. However, prior to 2017, Genm is a net cash company. 
  6. The effective tax rate of the Group for the current quarter ended 31 March 2019 is lower than the statutory tax rate mainly due to tax incentives and income not subject to tax, offset by non-deductible expenses. 
  1. The revenue in Malaysia grew positively by 12% as compared to Q4 2018. However, the management mentioned that overall business volume from gaming segment declined during the quarter due to reduction in incentives offered to the players as part of the cost rationalization initiatives.
  2. EBITDA in Malaysia is actually higher in Q1 2019 and i would said that the business is actually consider pretty stable. 
  3. PBT for Q1 2019 is lower mainly due to one off expenses of pre opening expenses and lower interest income receive during the quarter. 
  • Same as before, Genm strategy is to maximize its operating cost structure to mitigate the tax rate hike. 


Comment
  • Genm achieved highest revenue recorded in a single quarter proving that Genting is still one of the most popular vacation destination for Malaysian and tourists. 
  • As mentioned above, the drop in PBT is mainly due to one off pre opening expenses of RM 210 million and one off gain of disposal of RM 123 million. If exclude these one off income and expenses, Genm actually achieve a PBT of RM 369.4 million which is in line with their previous earnings. 
  • It seems like the tax rate hike didnt really hurt the company earnings in this quarter as there is tax incentive to cushion it.
  •  I personally think that the worst for Genm is over as the 2 main uncertainties or concerns have been proved invalid which are the tax rate hike might dampen Genm's earning (seems like Genm core earnings is still growing) and impairment on theme park (has already reflect in current quarter). 
  • Assuming that if the company is able to generate a EPS of 5 sen per quarter, at PE 17, Genm is worth RM 3.40. Genm payout 80% of its profit as dividend in 2017 & 2018, assume a same dividend payout ratio, Genm would payout 15 sen of dividend for 2019. At the current price of RM 3.09, its dividend yield is 4.8%.

Thursday, May 23, 2019

Ptrans Q1 2019

  1. Gross profit margin stood at 40% which is in line with their historical gross profit margin. 
  2. Other operating income which is rental of construction equipment stood at RM 2.1 million which accounts 40% of 2018 other operating income (if exclude other operating income, its PBT on Q1 2019 will be RM 6.6 million vs PBT on Q1 2018 of RM 5.1 million, an increment of 29%)
  3. Admin expenses increased by 13% while revenue increased by 9% (i think the main reason for general & admin expenses to increase is due to higher depreciation, as depreciation increased by RM 0.5 million as compared to previous quarter)
  4. Finance cost accounts for 21% of its PBT which is maintaining at a healthy level. 
  5. PBT improved by 53% if compared quarter to quarter however PAT remain flat as there is an income tax expense of RM 311k as compared to a tax credit of RM 2.7 million in Q1 2018 (if exclude the income tax, the company actually perform hell lot better in Q12019)
  1. Cash increased by RM 10 million or 34% in 2019 (thanks to its strong operating cash flow of RM 20 million VS lower amount spend on investing which is only RM 7 million). 
  2. Borrowings remain approximately the same which is RM 208 million however, its gearing ratio increased to 72% from 64%. 
  3. Total asset increased by 4.2% however total liabilities increased by 7% (meaning its debts actually increased faster than its assets)

  • IPTT operations shown have not include the earnings from Kampar terminal as the contribution will only starts kicking in during 2nd half of 2019 therefore, i expect its IPTT operations revenue to increase positively in 2019. 

  • Kampar Terminal will start operations in 2nd quarter of 2019 and expect to see contribution to come in in 2nd half of 2019. 
  • The management is positive with 2019 earnings. 


Comments
  • Although the EPS remain flat at 0.43 sen in this Quarter, however this is mainly due to:-
    • Lack of tax incentive to offset its tax in this quarter as mentioned above. 
    • Number of shares increased by 6%
  • Exclude the above incident, Ptrans actually perform a lot better as its PBT improved by 53% (if exclude its other operating income, PBT improved by 29%).
  • Ptrans proofs to have a solid cash flow where it manage to generates RM 20 million of positive operating cash flow in Q1 2019 as compared to a total of RM 27 million of operating cash flow being generated in 2018. 
  • Moving forward, if the amount to reinvest starting to reduce, i believe Ptrans is able to slowly pair down its debts to reduce its interest expenses. This will definitely assist to boost its earning moving forward. 
  • Management is positive with its 2019 performance and contribution from Terminal Kampar is coming in in 2nd half of 2019. Terminal Kampar is 8 times bigger than its Amanjaya terminal. 
  • The risk moving forward i would say is additional expenses incurred for its Terminal kampar or the cost of running for Terminal Kampar is higher than expected which could dampen its earnings. 
  • At current price of RM 0.195, its PE is 7.77 which is way below its ROE of 12.4. Assuming that Ptrans maintains its EPS at 0.6 sen per quarter, with 35% dividend payout ratio, its dividend will be 0.84 sen for 2019. At current price of RM 0.195, its DY is around 4.3%.


Saturday, May 18, 2019

Magni-Tech Industries Berhad (AR 2018)

Corporate Profile

  • Magni has 2 business segments:-
    • Garment manufacturing: contributes 90% to its revenue and 96% to its operating profits. Profit margin for this segment is 11.03%.
    • Packaging manufacturing: contributes 10% to its revenue and 4% to its operating profits. Profit margin for this segment is 3.8%.

  • 93% of garment revenue is derived from one single customer which is NIKE. Therefore, Magni's business is highly affected by the business of NIKE. 

  • 90% of its revenue are derived from export, with US, European and China being the top 3 countries. 


Financial Highlight
  • Revenue reduced by 6% while PBT reduced by 30% in 2018 from 2017. The main reason for PBT to decrease by 30% is because in 2017, there is a forex gain of RM 10 million while in 2018, its forex gain is merely RM 1.8 million. 2nd reason is because its admin and distribution expenses increased by RM 11 million in 2018 although the revenue dropped 6%. 
  • Dividend payout ratio is 35% of its net profit. 
  • Magni has high ROE of approximately 20%. 
  • I include investment securities to calculate its net cash position as investment securities consist of money market fund, shares and unit trust and it is actually a current asset. Taking account of this, Magni net cash position has reach a record high of RM 211 million or RM 1.30 cash per share in 2018. 
  • Allowance for impairment is merely 1% of its trade receivables which is very healthy. 


Futures Prospect
  • There is a lack of info on its futures prospect in the annual report. 


As at Q3 of 2019
  • PBT margin improved to 12.7% as compared to 11% in 2018. 
  • EPS for 3 quarters in 2019 has already accounted 88% of 2018 EPS (2019 can definitely perform better than 2018)
  • Drop in revenue is due to a drop in sales.
  • Cash and investment securities increased to a record high of RM 249 million as compared to RM211 million in 2018. Main reason for its cash to increased to RM 85 million is due to disposal of investment securities, not from operating. 
  • Garment manufacturing profit margin improved to 12.68% as compared to 11% in 2018 due to higher gain on foreign exchange by RM8.679 million, higher dividend income from money market unit trusts, and lower operating expenses incurred.
  • Packaging profit margin improved to 5.4% as compared to 3.86% in 2018 due to lower operating expenses incurred and higher miscellaneous income.

  • Not much being mentioned other than its usual comment. 


Strength
  • Strong balance sheet 
  • Assist NIKE which is a world renowned brand to manufacture its apparel. 
  • Export business where 90% of its revenue is derive from overseas therefore, strong USD is beneficial to magni. 


Weakness
  • Over dependent on NIKE as NIKE alone contributes over 80% of its revenue (however, magni has been helping NIKE to manufacture their garment for over a decade)
  • Lack of future prospect/growth internally. The growth is mainly from NIKE.


Valuation @ RM 4.50
  • Generally Magni's PE is ranged between 6 - 8 and can go up to 10 when the market is very bullish on its prospect. Therefore, i will conclude that a fair PE for Magni is 7 - 8. 
  • At RM 4.50, its PE is currently 7.25 (which is deemed to be fairly valued unless moving forward its earning is able to pull its PE lower) and its DY is 4.44%. At PE 8, Magni is worth RM 4.90. At PE 6, Magni is RM 3.70 and anything below RM 3.70 , there is a margin of safety for Magni (assuming the earning ability remains)


Technical Analysis
  • Technically, Magni is still moving in consolidation with support at 4.1 & 3.88.

Power Root Berhad (Annual Report 2019 & Q4 2020)

Company Background Pwroot is an instant drinks manufacturer with different brands to target different customers.  Ah Huat instan...