Saturday, November 30, 2019

Formosa Prosonic Industries Berhad (AR2018)

Corporate Profile
  • FPI is a sound system manufacturer with 30 years of experiences specialized in original equipment manufacturing (OEM) services including woodworking, plastic injection, driver units, PCB assembly and finished-products assembly as well as Original Design Manufacturing ("ODM") services. (OEM means FPI make devices from components parts bought from other company; ODM means FPI designs and manufactures a product, as specified, that is eventually rebranded by another firm for sale). However, FPI is still mainly in OEM business as they have dispose their ODM business of Acoustic Energy. 
  • FPI used to be an audio system and components manufacturer however diversified into musical instrument segment in 2014. 
  • FPI products and services:
    • Products
a. Musical Instrument Product: FPI clients include Roland, Casio, Korg etc. Roland contributes 80% of revenue to the musical instrument segment.  
b. Wireless Speaker Product: FPI clients include Sony, Panasonic, Bose, Sharp etc. Sony being their single largest customer.


c. Conventional Speaker Product such as home audio, speaker unit, plastic injection etc
    • Services: 
  • FPI derives its sales from Malaysia only after disposing its business in the UK (Acoustic Energy) 
  • 64% of FPI sales are contributed by 2 single customers. Meaning to say if the sales of these 2 clients dropped, it will greatly affect FPI's performance.
  • According to HLIB report, as at 2017, 22% of sales were from musical instrument segment while the 78% were from audio system and components (The management indicated that in 2018 AR, musical instrument segment continues to grow however the audio system and components business dropped in term of quantity delivered. Nevertheless, the sales increased. Details were not provided by the management). Suspect that Roland is customer B as if 25% of revenue were from musical instrument segment and Sony for Customer A according to article from Insider Asia. 
  • FPI currently has 2 manufacturing side, one in Port Klang, selangor and another one in Sungai Petani, Kedah (Production capacity remain unknow as no information was provided by the management).


  • Financial Highlight

  • Based on its revenue, FPI experienced a drop in sales since 2013 and recovered in 2017(This is because FPI sales is highly dependent on 2 of its major clients) 
  • Gross profit margin is in the range of 7% to 13%.
  • Net profit margin is in the range of 4% to 8% (We will do a net profit margin comparison with other EMS companies in Malaysia later)
  • Dividend payout ratio is in the range of 50% - 80% which is consider high. 
  • FPI is a net cash company with no bank borrowings. Net cash per share is 68sen. 
  • FPI has strong operating cash flow over the years and always generate free cash flow (meaning to said FPI is able to do consistent high dividend payout)
  • Impairment on trade receivables only constitutes  0.02% of its total trade receivables (meaning every RM100 of sales, only RM0.20 unable to recover)
  • FPI will greatly affected by USD because:
    •  30% of its cash is in USD
    •  36% of its trade receivables are collected in term of USD
    • 23% of its trade payables are paid in term of USD
    • Hence the strengthening of USD by 3% will lead FPI to have an forex gain of RM900k
  • Increase in minimum wage and foreign levy for foreign labor will greatly affect FPI as 75% of its employees are foreign labor. (currently the minimum wage for foreign labor is RM1100) 
    • 2018: 2529 out of 3331 (75%) workers are foreign labor. 
    • 2017: 1568 out of 2257 (69%) workers are foreign labor.
  • Employees expenses increased tremendously by 54% or RM36 million mainly due to increase in number of employees (increased by 47%). Revenue increased by 22% only. (Increase in number of employees is due to the additional factory used by Roland)  
  • FPI spend about RM1.7 million on R&D in 2018 which accounts 5% of its net profit. 


Future Prospects
  •  Not too much is being mentioned in the annual report:
    • Improvements across all its operations, including manufacturing, logistics, and quality systems.
    • Invested substantially in new injection machines, CNC machines and some automated machines. 
    • Work cells or Work Stations have also been reconfigured to reduce flow times and to eliminate Work-In-Process (“WIP”) within the production line
    • Elimination of non-value-added activities to the production process.
    • In December 2018, the new factory has commence operation with a 20% increase in production capacity to cater the new contracts received from Roland. 70% of the additional capacity will be taken up by Roland. According to HLIB report, Roland might shift some of its China and Indonesia operations over to Malaysia. 
    • FPI only diversified into musical instrument segment in 2014 and this segment is still growing with Roland contributes 80% of musical instrument revenue (曾經在日本上市的Roland公司,目前在歐洲擁有約30%市佔率,其樂器主打專業人士市場,且品牌口碑和信譽良好。」值得一提的是, Roland公司此前只在印尼和中國的2家廠房以聯營方式生產樂器配件,因此對於海外業務的控制權有限。直到2014年, Roland才于大馬以獨資形式,設立海外的第3間廠房,并獲得了大馬投資發展局(MIDA)提供的「主要樞紐」(Principal Hub)的稅務優惠和福利。Roland公司已在我國做好了中長期部署,有重點發展大馬業務,該公司發言人曾表示,將視大馬為繼日本之外第2個總部。大馬的廠房除了擁有所有股權,且政府也提供了多項津貼和獎掖,該公司料將原先于印尼和中國生產的配件,轉移到大馬生產,以降低生產成本)
    • FPI acquire a piece of land (20 acres) besides Wistron which believes would be used to built factory to cater orders for Wistron (starting to do speaker sales to Wistron Group in 2019).
    • Benefits from trade war if those MNC shift their orders to south east asia. 


Strength
  • Strong balance sheet with a net cash per share of 62 sen. 
  • Strong in generating free cash flow as proven over the years where FPI has the capability to distribute high dividend. 
  • Low impairment on trade receivables which means FPI is able to convert 99.8% of their sales into cash. 
  • Partnership with its major shareholder - Wistron Group which is a supplier of Apple, Dell, HP etc (starting to do speaker sales to Wistron Group in 2019). 
  • FPI do not require heavy capital expenditure to do business. 

Weakness
  • FPI is too heavily depends on individual customer as 65% of their sales were from 2 customers only. A reduction of their customer order will cause a huge impact on FPI's financial. 
  • Lack of automation in its production process. FPI is heavily dependent on foreign labor where 75% of their employees are foreign labor. Increase in minimum wage and foreign levy will affect FPI operating cost. 
  • Feels like the material cost of FPI fluctuate a fair bit by looking at its gross profit margin however it is still manageable(Gross Profit Margin for - 2015: 10%, 2016: 7%, 2017: 13%, 2018: 11%, 2019: 10%)


EMS peer to peer comparison
  • FPI is the smallest company amount the 5 electronic manufacturing services industry however it offers the highest dividend yield with lowest PE ratio. FPI also has the most cash in hand. 
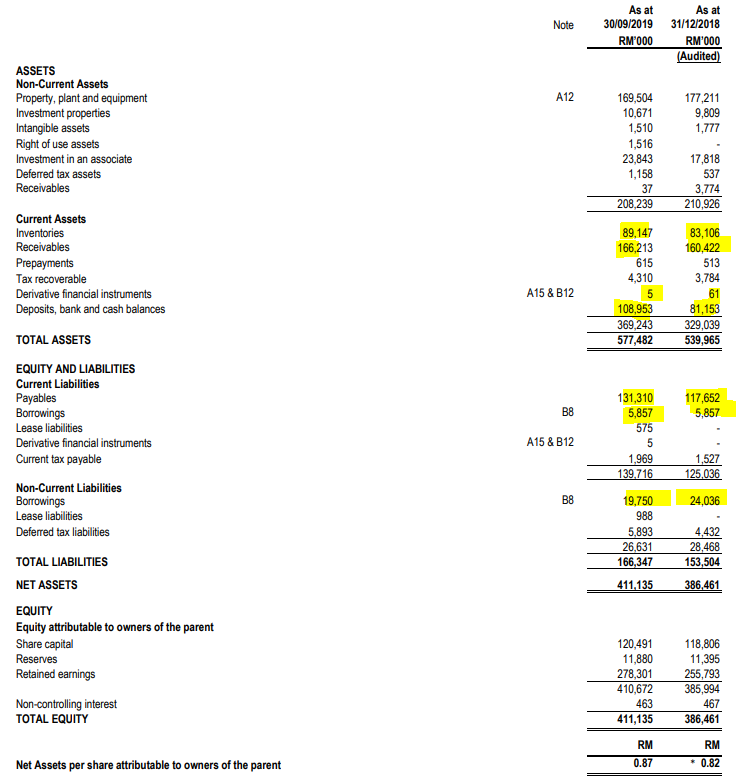

As at Q3 2019
  • Revenue increased by 43% while distribution and administrative cost increased by 10% which is acceptable (i think increase in labor cost in 2018 was to prepare for 2019 contract orders)
  • Increase in other income is mainly due to gain in forex. 
  • Increase in other expenses is mainly due to impairment loss on receivable of RM3.3 million.
  • Inventories were higher by 13% which means the contract order remain high. 
  • Trade receivables increased by 100% however its sales merely increased by 43% (this means that debts recovery has taken longer than usual - suspect is from Wistron)
  • Trade payable increase by 50%. 

  • Main reason for the increase in revenue was due to sales to Wistron which is its major shareholder (as you can see in 2018, FPI didnt sell any speaker to Wistron however RM142 million of sales was made through Wistron, which account for 25% of FPI revenue).
  • The management remain cautious due to rising raw material cost and rising operating cost due to minimum wage policy. 


Valuation at RM1.50

  • Q3 usually serves as the strongest quarter for FPI. 
  • At the price of RM1.50, its current PE is only 9.64 which is close to its 5 years average PE of 9.44. A fair PE for EMS company would be 14. At PE 14, FPI is worth RM2.19. [Undervalue]
  • At RM1.50 a share, its price to book value is 1.25. [Fair]
  • FPI has a net cash of RM152 million however its market capital right now is only RM375 million. Meaning to say its cash on hand already constitute 40% of its market capital. [Undervalue]
  • Assuming if FPI payout 11sen of dividend for 2019, at RM1.50 a share, its DY is 7.3% [Undervalue]


Thursday, November 28, 2019

GENM Q3 2019


  1. Genm's revenue increased by 7% to RM7.9 billion with both Malaysia and US increased 12% and 6% respectively while UK revenue dropped by 7% 
    • Malaysia -  the overall business volume from gaming segment declined in YTD Sept 2019 due to reduction in incentives offered to the players. The non-gaming segment revenue has increased by 36%.
    • US & Bahamas - due to the strengthening of USD against RM. Excluding this impact, revenue would have increased by 2% mainly due to higher volume of business from RWNYC operations.
    • UK & Egypt - due to lower hold percentage from its premium gaming segment in UK and lower revenue from Cairo, Egypt.
  2. However its EBITA dropped by 2% mainly dragged by businesses in Malaysia due to higher casino duty. However if you look at its EBITA margin as compared to 2017 & 2018, the EBITA margin actually maintains.
  3. There is a disposal gain of RM123 million from the disposal of a subsidiary in UK.
  4. Lower interest income received in 2019 is due to impairment of the Group’s investment in the promissory notes issued by the Tribe in 2018.
  5. Finance cost increased by RM76 million due to lower qualifying assets eligible for interest capitalisation during the period and there is an increase in bank borrowings.

  1. Cash at bank reduced 11.2% and bank borrowings increased 1.9% (Its gearing ratio increased to 16% from 9%.) 


  1. The management mentioned that the outlook for gaming business remain challenging. 
  2. Outdoor theme park expected to open on time which is Q3 2020. 
  3. Genm acquire LeoVegas Mobile Gaming Group's subsidiary Authentic Gaming for RM70 million to strengthen its footprint for online gambling in UK. 
  4. Resort world NYC is still under expansion to maintain its market leader position in northeast US region. Starting 2020, RW catskill will start to contribute its revenue and losses. 

Comments: 


  1. Overall speaking, Genm has reported a higher revenue with a stagnant profit which is considered as good (However its EBITA margin remain competitive which its there is no issue with its core operation).
  2. However its gearing ratio increase from 15% from the previous quarter to 16% this quarter. Genm has a series of acquisition on UK Authentic Gaming and US Empire Resort which might prevent it from giving special dividend this year (This is the risk).
  3. At current price of RM3.11 its PE is only 12.60. With PE 18, its share price will be RM4.44. If there is no special dividend, at RM3.11 a share, a dividend payout of 11 sen will be 3.5%.

Saturday, November 23, 2019

ELSOFT 2019 Q3

  1. Revenue and net profit dropped 58% due to lower demand of automated testing equipment (ATE) as explained by the management (On the positive side, its net profit margin actually maintain at 51%).
  2. Elsoft reported a higher other income mainly due to forex gain and gain on fair value adjustment on other investment.
  3. With lower revenue recorded, Elsoft also manage its administrative expenses with a drop of 27%.
  4. Although the earnings dropped, Elsoft actually increase its dividend payout. Elsoft make 2.09 sen but payout 2.5 sen of dividend (Elsoft usually only pays about 70 - 80% of its profit as dividend). 
  1. Elsoft remain as a company with no borrowings with a cash pile of RM63 million or net cash per share of 0.10 sen. 
  2. Its inventories dropped from RM 5.7 million in previous year to RM 4 million as at Q3 2019 (Could this mean its business is experiencing further slowdown hence lower inventory level?)
  3. When the sales is at RM 78 million its trade receivables is RM 14 million (trade receivables is 17% of revenue) , however in 2019, its sales is merely RM 27 million, its trade receivables is RM 10 million (trade receivables is 37% of revenue)

  1. Main reason for the drop in business is due to Malaysia based client. There is one single MNC client dominates 75% of Elsoft business in Malaysia (Obviously that client has purchased lesser testing equipment this year).

  1. The company expect the demand remain weak and the situation remain challenging. 

Comments

  1. The weak revenue reported is way lower than expected. The last time that Elsoft report a RM 4 million revenue in a single quarter was in Q2 2015. 
  2. I think we could use the financial in 2014 as a reflection of Elsoft financial in 2019 - 2020. Its share price during that point of time is RM0.20. 
  3. Assuming if there is another 0.5 sen of dividend being paid in Q5 which bring it up to a 3 sen dividend payout, at RM 0.9, its DY is merely 3.33%.
  4. The average PE of Elsoft for the past 5 years is 17.5, hence at PE 17.5 and EPS of 3 sen, its share price is RM0.52. At 0.52, its DY is 5.7%
Weakness
  1. Over rely on single client hence once the major client reduce its purchase, we will see a major decrease in sales. 
  2. Over rely on single product - LED automated testing equipment, hence a drop in demand in ATE will cause a drop in sales.
  3. Why would the demand for LED automated testing equipment for automotive and smart device drop when the automotive and smart device sales maintain? 
  • Car sales in 2019 maintain at 600k vehicles however the sales of Elsoft dropped 60%? 

  • Demand for smart device actually increased every year but sales of Elsoft dropped? 


Thursday, November 21, 2019

Ahealth Q3 2019


  1. Revenue increased by 5.8% while selling, marketing and administrative expenses merely increased by 1.9% (very good cost management).
  2. Gross profit margin is at 22.37% which is in line with the gross profit margin in the past years. (Average gross profit margin of Ahealth is between 21% - 25%). 
  3. Profit contribute from its associate (Straits Apex Sdn Bhd) increased 11% to 6 millions which contributes 12% to its profit before tax (In 2018, Straits Apex SB contributes 11% to Ahealth PBT).

  1. Cash at bank increased 34% to RM109 millions as compared to year 2018 (This proves Ahealth has very strong cash generating ability).
  2. Bank borrowings currently stood at RM25 millions (Ahealth generates RM50 million of operating cash flow in 9 months, meaning to say that Ahealth is able to settle its debts in no time)
  3. Revenue of Ahealth increased by 5.8% however its inventories increased by 7.2% (meaning the business is still is expected to grow in this range moving forward). Trade receivables increased by 3.6% (This is in line with the revenue growth) while trade payables increased by 11.6% (meaning to say Ahealth doesnt allow its debtors to own them money for too long while Ahealth have the ability to request for a longer credit term).

  1. Lets do a simple calculation: PBT for cumulative 9 months is RM47,850 + RM4,360(depreciation) + RM559(impairment) + RM960(inventories WO) - RM278 (forex loss) = RM54,007. So if we take away the additional one off expenses and the additional depreciation incurred by SPP Nova, Ahealth actually achieve RM 54 million of PBT which is even higher than previous year PBT of RM52 million. 

  1. Strong cash flow from operating of RM50 million in 9 months as compared to RM34 million in 2018. 
  2. As you can see that the amount that Ahealth spend on purchase of PPE reduced significant where it will further strengthen its cash flow. 
  1. Ahealth achieves the highest quarterly revenue result of strong contributions from both private and public sector sale of Group branded pharmaceutical products.
  2. During the quarter, the Group’s wholly owned manufacturing subsidiary Xepa-Soul Pattinson (M) Sdn Bhd secured the EN ISO 13485:2016 accreditation for the Design and Development, Manufacture and Distribution of Sterile Eye Drops, a Medical Device category, certifying compliance with European Union standards.
  3. Ahealth also mentioned that they will record a lower sales in Q4 from its associates due to postponed orders.  

Comments

  1. At current price of RM2.40, its PE is 20.3 which is the highest in Ahealth history. Average PE of Ahealth is 14.83 over the past 5 years. Assuming if Ahealth achieve an EPS of 11 sen for year 2019, At PE of 14.83, its share price is RM 1.63.
  2. Ahealth is a great company where its futures growth is visible. However 2019 is a resting year for Ahealth due to additional production cost by SPP Novo. Once the depreciation from SPP Novo is neutralized or mitigate by higher sales contributed by it, then its profit will started to grow again. Ahealth is worth to collect anything below RM1.80. 


Tuesday, November 19, 2019

RCECAP Q2 2020

  1. Revenue increased by 6.95% while net profit increased by 9.9% (Well done to the management on the cost controlling).
  2. Interest income increased by 9.37% while interest expenses associates to revenue increased by 7.05% (might due to borrowing rate as bank negara lower the OPR)
  3. Director and staff salary increased by 7.05% which is in line with its increase in revenue. 
  4. Allowance for impairment loss reduced by 25.5% (Improvement on the quality of loan)
  5. Net profit margin improved 37.39% from 36.38%. 

  1. Its total assets decreased by 3.73% as compared to last year mainly due to a reduction in cash. 
  2. Although the total assets decreased, its loans and receivables actually increased by 2.88% (meaning to say the loan business actually grows).
  3. Bank borrowings dropped by 7.88% as compared to last year (This is something WOW! image your overall business increase by 6.95%, your loan receivables increased by 3.73% however your bank borrowings decreased by 7.88%. Meaning Rcecap actually uses the money effectively).
  4. Gearing ratio is currently 1.77 which is lower than last year's gearing of 1.91.

  1. With such amazing quarter report, the management still remain cautious with the outlook and didnt sound too pessimistic. 

Comments
  1. Valuation of Rcecap at RM1.77
    • At currently price of RM1.77, its PE is merely 6 which is not consider as too expensive. At PE8, Rcecap is worth RM2.33. 
    • Rcecap usually distribute 30 to 35% of its net profit as dividend. Assuming if Rcecap is able to achieve an EPS of 30 sen, a 10 sen dividend payout is expected. At RM 1.77 a share, its DY is 5.6%. 
    • Its NTA is 1.69, hence at RM1.77 a share, its price to book value workout to be 1.04 which is very fair. However if we use its net asset per share of RM1.80 to calculate, its price to book value is 0.98 which is undervalue. 
    • Conclusion: even at the price of RM1.77, Rcecap doesnt seems to be too expensive. Considering that the volume has started to increase, any correction is consider an opportunity to collect. 


Power Root Berhad (Annual Report 2019 & Q4 2020)

Company Background Pwroot is an instant drinks manufacturer with different brands to target different customers.  Ah Huat instan...