Friday, May 31, 2019

Amway Q1 2019

  • Gross profit margin and net profit margin of Amway shrink further to 23.81% and 4.29% from 24.71% and 5.61% respectively in 2018. 
  • Distribution, selling and administration expenses accounts for 18.6% in Q1 2019 as compared to 18.17% in 2018. 
  • From the above chart, we can see that USD/MYR dropped from January, February and March 2019 but still the margin of Amway shrink as compared to previous quarter? (not too sure about Amway hedging policy on USD). The average USD/MYR rate for Jan - Mar 2019 is 4.07
  • The management is optimistic that the sales will continue to grow as the management mentioned that they will increase their selling price effective March 2019. However, the profit margin might be under pressure due to unfavorable USD rate. 

Comments

For the moment, there is no sign of recovery for Amway yet as their gross profit margin is below its benchmark of 24.5%. USD is on the rise as well. Hopefully the increase in product price will mitigate their cost of import however will it be harder for its ABO to sales their product as it becomes more expensive? 

At current price RM 5.83, its PE is 16.77 which is the lowest since 2014 and its DY is 4.72%. Amway achieve an EPS of 6.5 sen for the quarter, assuming if Amway generates an EPS of 28 sen for 2019, at PE 18 - Amway is worth RM 5.04, at PE 20 - Amway is worth RM 5.60. 


Thursday, May 30, 2019

YSPSAH Q1 2019

  • Gross profit margin for Q1 2019 is 43% which is reasonable however is below its benchmark as previously its gross profit margin always range from 44% - 47%. 
  • Selling, distribution and admin expenses accounts for 31.71% in Q1 2019 vs 31.43% in 2018. 
  •  Profit before tax margin stood at 9.36% in Q1 2019 which is lower than its benchmark. From year 2013 - 2018, YSPSAH manage to achieve a PBT margin of more than 11%. 
  • Net profit margin shrink to 6.62% which is below its benchmark of 7% - 11%.
  • Overall, the main reason for the drop is due to lower gross profit margin. 

  • YSPSAH has a net cash per share of RM 0.30 increased from RM 0.27 previously. Borrowings decreased from RM 39 million as per 2018 annual report to RM 34 million for the current quarter. 
  • The main reason for the business to slow down is due to lower overseas sales and lower profit margin for the current quarter. 
  • Overall, the management is positive with its performance for 2019. 
  • The company is working on improving efficiency, increase product offering and promotion to increase market shares. 

Comments
Overall, the company perform slightly below benchmark for the current quarter due to higher cost of sales. Nevertheless, the demand for pharmaceutical products will always be there regarding how the economic perform. It is worth waiting for another 2 more quarters to find out how the company will generally perform in year 2019. At the price of RM 2.44, its PE is 11.9, ROE is 8.90, profit margin slide to 6.5%, DY is 3.48%.


Saturday, May 25, 2019

Genm Q1 2019


  1. Gross profit margin stood at 24.93% which is slightly lower than its 2018 gross profit margin of 26.82%.
  2. Other income stood at RM 193 million in Q1 2019 which accounts 40% of 2018 other income of RM 483 million mainly due to recognition of a gain of RM 123.8 million from the disposal of a subsidiary in UK.
  3. Other expenses increased by 83% mainly due to provision of related costs as a result of the termination of contracts related to the outdoor theme park at Resorts World Genting of RM 198.3 million.
  4. Genm incurred an impairment loss of RM 17 million in Q1 2019 which is quite normal as in 2017 Genm has an impairment loss of RM 54 million. 
  5. Finance cost accounts for 26% of Genm net profit which is still manageable and their gearing ratio is currently 10% as compared to 9% in 2018. However, prior to 2017, Genm is a net cash company. 
  6. The effective tax rate of the Group for the current quarter ended 31 March 2019 is lower than the statutory tax rate mainly due to tax incentives and income not subject to tax, offset by non-deductible expenses. 
  1. The revenue in Malaysia grew positively by 12% as compared to Q4 2018. However, the management mentioned that overall business volume from gaming segment declined during the quarter due to reduction in incentives offered to the players as part of the cost rationalization initiatives.
  2. EBITDA in Malaysia is actually higher in Q1 2019 and i would said that the business is actually consider pretty stable. 
  3. PBT for Q1 2019 is lower mainly due to one off expenses of pre opening expenses and lower interest income receive during the quarter. 
  • Same as before, Genm strategy is to maximize its operating cost structure to mitigate the tax rate hike. 


Comment
  • Genm achieved highest revenue recorded in a single quarter proving that Genting is still one of the most popular vacation destination for Malaysian and tourists. 
  • As mentioned above, the drop in PBT is mainly due to one off pre opening expenses of RM 210 million and one off gain of disposal of RM 123 million. If exclude these one off income and expenses, Genm actually achieve a PBT of RM 369.4 million which is in line with their previous earnings. 
  • It seems like the tax rate hike didnt really hurt the company earnings in this quarter as there is tax incentive to cushion it.
  •  I personally think that the worst for Genm is over as the 2 main uncertainties or concerns have been proved invalid which are the tax rate hike might dampen Genm's earning (seems like Genm core earnings is still growing) and impairment on theme park (has already reflect in current quarter). 
  • Assuming that if the company is able to generate a EPS of 5 sen per quarter, at PE 17, Genm is worth RM 3.40. Genm payout 80% of its profit as dividend in 2017 & 2018, assume a same dividend payout ratio, Genm would payout 15 sen of dividend for 2019. At the current price of RM 3.09, its dividend yield is 4.8%.

Thursday, May 23, 2019

Ptrans Q1 2019

  1. Gross profit margin stood at 40% which is in line with their historical gross profit margin. 
  2. Other operating income which is rental of construction equipment stood at RM 2.1 million which accounts 40% of 2018 other operating income (if exclude other operating income, its PBT on Q1 2019 will be RM 6.6 million vs PBT on Q1 2018 of RM 5.1 million, an increment of 29%)
  3. Admin expenses increased by 13% while revenue increased by 9% (i think the main reason for general & admin expenses to increase is due to higher depreciation, as depreciation increased by RM 0.5 million as compared to previous quarter)
  4. Finance cost accounts for 21% of its PBT which is maintaining at a healthy level. 
  5. PBT improved by 53% if compared quarter to quarter however PAT remain flat as there is an income tax expense of RM 311k as compared to a tax credit of RM 2.7 million in Q1 2018 (if exclude the income tax, the company actually perform hell lot better in Q12019)
  1. Cash increased by RM 10 million or 34% in 2019 (thanks to its strong operating cash flow of RM 20 million VS lower amount spend on investing which is only RM 7 million). 
  2. Borrowings remain approximately the same which is RM 208 million however, its gearing ratio increased to 72% from 64%. 
  3. Total asset increased by 4.2% however total liabilities increased by 7% (meaning its debts actually increased faster than its assets)

  • IPTT operations shown have not include the earnings from Kampar terminal as the contribution will only starts kicking in during 2nd half of 2019 therefore, i expect its IPTT operations revenue to increase positively in 2019. 

  • Kampar Terminal will start operations in 2nd quarter of 2019 and expect to see contribution to come in in 2nd half of 2019. 
  • The management is positive with 2019 earnings. 


Comments
  • Although the EPS remain flat at 0.43 sen in this Quarter, however this is mainly due to:-
    • Lack of tax incentive to offset its tax in this quarter as mentioned above. 
    • Number of shares increased by 6%
  • Exclude the above incident, Ptrans actually perform a lot better as its PBT improved by 53% (if exclude its other operating income, PBT improved by 29%).
  • Ptrans proofs to have a solid cash flow where it manage to generates RM 20 million of positive operating cash flow in Q1 2019 as compared to a total of RM 27 million of operating cash flow being generated in 2018. 
  • Moving forward, if the amount to reinvest starting to reduce, i believe Ptrans is able to slowly pair down its debts to reduce its interest expenses. This will definitely assist to boost its earning moving forward. 
  • Management is positive with its 2019 performance and contribution from Terminal Kampar is coming in in 2nd half of 2019. Terminal Kampar is 8 times bigger than its Amanjaya terminal. 
  • The risk moving forward i would say is additional expenses incurred for its Terminal kampar or the cost of running for Terminal Kampar is higher than expected which could dampen its earnings. 
  • At current price of RM 0.195, its PE is 7.77 which is way below its ROE of 12.4. Assuming that Ptrans maintains its EPS at 0.6 sen per quarter, with 35% dividend payout ratio, its dividend will be 0.84 sen for 2019. At current price of RM 0.195, its DY is around 4.3%.


Saturday, May 18, 2019

Magni-Tech Industries Berhad (AR 2018)

Corporate Profile

  • Magni has 2 business segments:-
    • Garment manufacturing: contributes 90% to its revenue and 96% to its operating profits. Profit margin for this segment is 11.03%.
    • Packaging manufacturing: contributes 10% to its revenue and 4% to its operating profits. Profit margin for this segment is 3.8%.

  • 93% of garment revenue is derived from one single customer which is NIKE. Therefore, Magni's business is highly affected by the business of NIKE. 

  • 90% of its revenue are derived from export, with US, European and China being the top 3 countries. 


Financial Highlight
  • Revenue reduced by 6% while PBT reduced by 30% in 2018 from 2017. The main reason for PBT to decrease by 30% is because in 2017, there is a forex gain of RM 10 million while in 2018, its forex gain is merely RM 1.8 million. 2nd reason is because its admin and distribution expenses increased by RM 11 million in 2018 although the revenue dropped 6%. 
  • Dividend payout ratio is 35% of its net profit. 
  • Magni has high ROE of approximately 20%. 
  • I include investment securities to calculate its net cash position as investment securities consist of money market fund, shares and unit trust and it is actually a current asset. Taking account of this, Magni net cash position has reach a record high of RM 211 million or RM 1.30 cash per share in 2018. 
  • Allowance for impairment is merely 1% of its trade receivables which is very healthy. 


Futures Prospect
  • There is a lack of info on its futures prospect in the annual report. 


As at Q3 of 2019
  • PBT margin improved to 12.7% as compared to 11% in 2018. 
  • EPS for 3 quarters in 2019 has already accounted 88% of 2018 EPS (2019 can definitely perform better than 2018)
  • Drop in revenue is due to a drop in sales.
  • Cash and investment securities increased to a record high of RM 249 million as compared to RM211 million in 2018. Main reason for its cash to increased to RM 85 million is due to disposal of investment securities, not from operating. 
  • Garment manufacturing profit margin improved to 12.68% as compared to 11% in 2018 due to higher gain on foreign exchange by RM8.679 million, higher dividend income from money market unit trusts, and lower operating expenses incurred.
  • Packaging profit margin improved to 5.4% as compared to 3.86% in 2018 due to lower operating expenses incurred and higher miscellaneous income.

  • Not much being mentioned other than its usual comment. 


Strength
  • Strong balance sheet 
  • Assist NIKE which is a world renowned brand to manufacture its apparel. 
  • Export business where 90% of its revenue is derive from overseas therefore, strong USD is beneficial to magni. 


Weakness
  • Over dependent on NIKE as NIKE alone contributes over 80% of its revenue (however, magni has been helping NIKE to manufacture their garment for over a decade)
  • Lack of future prospect/growth internally. The growth is mainly from NIKE.


Valuation @ RM 4.50
  • Generally Magni's PE is ranged between 6 - 8 and can go up to 10 when the market is very bullish on its prospect. Therefore, i will conclude that a fair PE for Magni is 7 - 8. 
  • At RM 4.50, its PE is currently 7.25 (which is deemed to be fairly valued unless moving forward its earning is able to pull its PE lower) and its DY is 4.44%. At PE 8, Magni is worth RM 4.90. At PE 6, Magni is RM 3.70 and anything below RM 3.70 , there is a margin of safety for Magni (assuming the earning ability remains)


Technical Analysis
  • Technically, Magni is still moving in consolidation with support at 4.1 & 3.88.

Tuesday, May 14, 2019

Ptrans Q&A from management

1) Note 9/page 91 of 2018 annual report (taxation) - the company have a reinvestment allowance of approximately RM 10 million to offset against its income tax in 2018, may i know how many years does the reinvestment allowance last? Can the company deliver a double digit growth moving forward once the reinvestment allowance is fully utilized? 
  • Based on the annual report page 90, the estimated unutilised investment allowances is RM138,223,491. Our company is allowed to claim up to 60% of the capital expenditure invested to be offset against 70% of its statutory income until year 2020.

2) Note6/page 88 of 2018 annual report (other operating income) - the company has an additional RM 3.5 million of rental income received during the year as compared to 2017. May i know where does the rental income derive from? Is that rental income sustainable moving forward? 
  • Our company owned some construction equipment like tower crane, forklift, main pump n etc. The rental income is mainly consist of the rental of those construction equipments. 

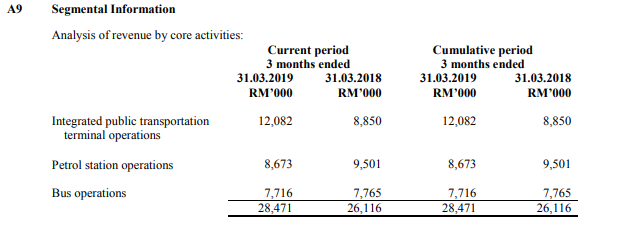
3) Note 30/page 116 of 2018 annual report (segment information) - the company's public transport operation segment incurred a loss of RM 32,000 during the year as compared to year 2016 and 2017 where the profit margin for public transport operation is 15% and 8% respectively. May i know what is the reason for the public transport operation segment to make a loss when Perak Transit Berhad dominate 97% of the bus transport business in Perak? May i also know what is the main reason for the profit margin of public transport operation to decrease from 15% to 8% and incur a loss in 2018?
  • The losses recorded in the bus operation is mainly due to the accumulated one-off charges by APAD due to the instability of the Electronic Ticketing Machine. We are negotiating these charges with the authority. These charges would need to be provided for in year 2018 due to the accounting standard.

4) Note 17/page 102 of 2018 annual report (trade receivable) - the company's trade receivable increased by approximately 80% however its revenue merely increased 7%. May i know what is the main reason for trade receivable of Perak Transit Berhad to increase exponentially in 2018? Is it due to the deposit collection for its Kampar Terminal? if otherwise, please advice. 
  • The increase in the trade receivables are mainly due to the increase in revenue, the extension of the credit period and the biling towards the end of the month.

5) From my understanding that the income from integrated public transport terminal operation consist of rental of A&P spaces, rental of shop & kiosk, bus & taxi entrance fee collection, parking fee collection and project facilitation fee. Can you please explain what is project facilitation fee and how does it work? How much does it contributes to IPTT operations? 
  • Project facilitation fee is the fee paid to provide consulting services in relation to bus terminal development and operations to prospective clients. 

6) Phase 1 of Kampar Terminal is expecting to operate in 2nd half of 2019. Based on your company projection, how much start up cost will incur to get Kampar Terminal up and run? 
  • Sorry to inform that we are not allowed to disclose the projected figures.

7) From my understanding there is a mall and hotel attached to Kampar Terminal. May i know what is the tenancy take up rate  for the mall of Kampar Terminal up to date? 
  • Sorry to inform that we are not allowed to disclose the projected figures.

8) How much revenue and profit does Perak Transit Berhad project to generate from Kampar Terminal once it is fully operates? 
  • Sorry to inform that we are not allowed to disclose the projected figures.

9) What is the competitive advantage of Kampar Terminal and how does it compliment its Amanjaya Terminal? 
  • Terminal Kampar Putra is located in a University town. There is no supermarket in Kampar and its surrounding towns. We are offering a  lifestyle hub to the students and residents in Kampar and its surrounding towns.

Saturday, May 11, 2019

Y.S.P Southeast Asia Holding Berhad (AR 2018)

Corporate Profile
  • 37.84% of its shares is owned by its parent company in taiwan YSP International Company Limited which is a subsidiary of Yungshin Global Holdings Corp listed in Taiwan. Top 30 shareholders accounts for 76% of its shares. 
  • YSPSAH is Yungshin Global's investment arm in South East Asia. From the above info, we can see that YSPSAH gross profit margin, PBT margin, ROE are quite identical to its mother company. 
  • Export licences held by YSPSAH totalled 1,232 and they consisted of pharmaceutical, veterinary and aquatic, cosmetic, and Traditional Chinese Medicine (TCM) products as well as medical devices.
  • The total registered products for Y.S.P.SAH ballooned to 464 (420 in the previous year) and they are made up of 355 pharmaceutical products and 109 veterinary products (approximately 25% of its products are veterinary products) 
  • YSPSAH has 3 manufacturing plants:-
    • Malaysia - manufacturing plan in Bangi has recently just upgraded to reduce cost and increase efficiency by adding machinery to boost the production capacity. New tablet press machines, new high-speed packing machines, and packaging material automatic counting and folding machines to optimize processes.
    • Vietnam - pharmaceutical and veterinary factory in Vietnam, has added a new production line – Beta-lactam production line. This was completed and granted GMP status in mid-2018. 89 new products were registered in Vietnam in the year under review.
    • Indonesia - PT. YSP Industries Indonesia (PTYSPII) pharmaceutical plant embark on adding a new Solid Line in the new financial year in the effort to increase its product line to include tablets and capsules.
  • Most of YSPSAH products are sold to private clinics, hospitals and pharmacies which accounts for 75%, 15% of income are from veterinary and aquatic products while OTC products accounted for 10%.
  • 95% of YSPSAH revenue and PBT were contributed from manufacturing of  pharmaceutical products and its profit margin is ranged from 11% - 14%.


  • Worth to acknowledge that the directors salary is only 3.8% of its profit before tax. 

  • 72.7% of its sales were derived in Malaysia with the remaining 27.3% from exports. 
  • Sales in export markets increased 4.9% while local market increased 12.5% in 2018 from 2017.
  • It is also worth taking note that it doesn't have any single client that contributes more than 10% of its revenue which is a big plus plus for YSPSAH. 


Pharmaceutical Industry
  •  The domestic pharmaceutical market as a whole valued at RM7.5 billion as at the third quarter of 2018 by the Malaysian Pharmaceutical Association of Malaysia. 
  • Generic drugs accounts for  21% (copies of brand-name drugs that have exactly the same dosage and effects as the original drug) , over-the-counter (OTC) medicines 24% (medicines sold directly to a consumer without a prescription from a doctor) and originator drugs 55% (the first drug containing its specific active ingredients to receive approval for use)
  • Market growth has been relatively fast, at between 8 and 10 per cent annually in the last decade.
  • Local pharmaceutical manufacturing companies only account for less than 30% of Malaysia's drugs market share with remaining 70% being imported drugs.
  • According to the Malaysian Organization of Pharmaceutical Industries (MOPI), Malaysia manufacturers currently export to countries in Southeast Asia, Africa and the Middle East. Growth in exports has been climbing steadily at 10-12% annually 

Financial Highlight
  • Revenue grew at CAGR of 7% from 2013 - 2018.
  • Gross profit margin were steady over the 6 years between 45% - 50%. 
  • PBT margin were steady over the 6 years which is above 10%. 
  • Dividend payout ratio range between 30% to 50%. 
  • ROE is decent at 10%.
  • The borrowings increased by 100% in 2018 as compared to 2017 is due to its purchase of PPE of RM 28 million. 
  • Net cash company with RM 0.27 sen of cash per share in 2018.
  • YSPSAH spend RM 28 million on purchase of plant & equipment which is the highest since 2013. (however, will that translate into higher efficiency in the coming 2 years?)
  • The total profit before tax for YSPSAH is RM 195 million over the 6 year where the operating cash flow generates were RM 161 million (meaning they manage to turn all their sales into cash)


Futures Prospect
  • Expansion of the plant in Bangi, Selangor, which will result in the oral solid dosage manufacturing capacity being doubled. The utilisation capacity has reached 70 per cent in current round-the-clock operation.
  • Increase the storage capacity of the raw material warehouse as well as the introduction of “online” pre-packing to reduce manual human operation resulting in greater cost savings.
  • Venture into technological advanced manufacturing process will be in collaboration with local institution.
  • Further expansion of product portfolio from pharmaceutical to veterinary, Over-the-Counter, medical devices and food supplements.
  • In the area of exports, the plan is to increase participation in Government tenders in ASEAN and African countries and also to advance into developed and regulated markets such as Canada, Australia, and New Zealand. 


Strength 
  • Being a subsidiary of Yungshin Global Holding Corp give them access to its parent's company technology and expertise. 
  • Enjoy the global trademark or brandname of Y.S.P as Y.S.P currently has presence in South East Asia, Japan, US, China and Taiwan. 
  • Overseas market only accounts for 30% of YSPSAH revenue, therefore, there are more room for them to grow. (However the donwside to this is that most of South East Asia countries like Myanmar, Vietnam, Cambodia and Indonesia has low awareness on heathcare) 
  • Low single customer risk (YSPSAH do not have any single customer that contributes more than 10% of its revenue).
  • Solid balance sheet and consistently generate positive cash flow through its operating. 
  • Stable earnings ability (YSPSAH did not have any loss making quarter since 2007)
  • Demand for drugs and medicines are always on the rise and is less cyclical. 


Weakness
  • YSPSAH products are mostly generic drugs therefore, YSPSAH has not much competitive advantage over other pharmaceutical companies in term of products differentiation. 
  • Most of YSPSAH clients are private hospital, clinics and pharmacies and is lacking of government hospital contracts which consume more generic drugs as they are cheaper compare to patterned drug.(this is also their strength as they do not need to depends on government to do business) 
  • YSPSAH needs to compete with foreign pharmaceutical companies in Malaysia market, as import of drugs are tariff free as it is medical supplies. 
  • Lack of institutional/fundhouse holding it (there is only one fund which is PB ISLAMIC SMALLCAP FUND appear as its top 30 shareholders)


Peer to Peer Comparison
  • Dpharma (Market Cap: RM 880 M, PE: 18.42, ROE: 9.89,   DY: 6.40%, Profit Margin: 9.6%, Gearing ratio: 30%)
  • Ahealth   (Market Cap: RM 1.03 B, PE: 17.69, ROE: 15.30, DY: 1.53%, Profit Margin: 9%, Net cash: 0.43/share)
  • Kotra       (Market Cap: RM 247 M, PE: 12.54, ROE: 11.93, DY: 2.91%, Profit Margin: 11.4%, Gearing ratio: 14.3%)
  • Pharma    (Market Cap: RM 630 M, PE: 14.85, ROE: 8.32,  DY: 6.61%, Profit Margin: 1.8%, Gearing ratio: 115%)
  • Yspsah     (Market Cap: RM 330 M, PE: 10.90, ROE: 9.57, DY: 3.57%, Profit Margin: 10.5%, Net cash: 0.27/share)
* Out of the 5 companies, only YSPSAH and Ahealth are net cash company and YSPSAH has the lowest PE. 

Valuation @ RM2.38
  • At current price of RM 2.38, YSPSAH is trading at PE of 10.90 and its dividend yield is 3.5%. 
  • At PE of 10 its share price will be RM 2.18 and DY will be 3.9% (so anything below this, i will say there is a margin of safety).
  • From above peers comparison, the fair PE for pharmaceutical company range between 12 - 15. At PE 12, YSPSAH is worth RM 2.62. At PE 15, YSPSAH is worth RM 3.25 (this is based on the assumption that YSPSAH is able to at least maintain its earning in 2019)


Technical Analysis
YSPSAH is currently a falling knife with high selling volume. Next support is at 2.33 followed by 2.23.

Tuesday, May 7, 2019

Harta Q4 2019


  • Gross profit margin reduced from 25.56% in 2018 to 20.23% in 2019 due to sharp strengthening of the ringgit in a short time frame as the Group was unable to pass on the corresponding cost increase to customers in a timely manner. (This actually means that if given sufficient time frame, Harta has the ability to pass the additional cost to its customer)
  • Net profit merely increased 3.7% in 2019 as there is an other operating income of  RM 46 million in 2018 oppose to other operating expenses of RM 10 million in 2018 (if exclude the other operating income/expenses, the net profit would have an increment of 18% in 2019). 

  • Although borrowings increased slightly however its gearing ratio remain at a very healthy level of 9% (increased from 8% in 2018).
  • Total assets increased by 13.66% however total liabilities increased by 15.19%. 
  • Harta has invested approximately RM 2 billion on its expansion on NGC up-to-date (there is another half a billion to invest to fully complete its NGC expansion plan which is expect to finish in the coming 2 years)
  • The cash flow from operating generated is extremely strong at RM 625 million (Harta is very capable to complete its remaining expansion without further borrowings and have the ability to become a cash rich company once it finish its expansion plan)

Futures Prospect


Comments
Although news has been saying that there might be an oversupply of glove moving forward and the management also highlight the issue in its future prospect and also believe that the new capacity will be taken up slowly (this is evidence by the strong revenue growth in 2019). Management also come out with a solution to solve the issue of gross profit margin under pressure. Overall, the management is positive with its own long term prospect and if there is a drop in share price due to this, it is definitely a chance to accumulate. At PE of 32, Harta is worth RM 4.36.


Sunday, May 5, 2019

Amway (Malaysia) Holdings Berhad (AR 2018)

Corporate Profile

  • One of the biggest MLM company worldwide. 
  • 51% of Amway shares hold by its mother company under GDA B.V where Amway paid a royalty of RM 2.6 million in 2018 which accounts 1% of its gross profit.
  • 91% of Amway shares are hold by its top 30 shareholder with EPF holding 6.8%, Amanah Saham holding 20.22%, KWAP holding 9.11%, fund house holding 1.77%. (87% of Amway share are in the hands of government entity and Amway itself)
  • Amway has 254,000 Amway Business Owner (ABO) in 2018 compared to 252,000 ABO in 2017.


Financial Highlight


  • Revenue decreased 1.21% in 2018 from 2017. 
  • Revenue grew at merely CAGR of 2% from 2013 to 2018.
  • Gross profit decreased 1.6% in 2018 from 2017 which is in line with the decrease in revenue. 
  • Net profit increased by 3.59% in 2018 from 2017 even though its revenue and gross profit decreased. This is due to lower income tax paid as there is an income not subject to tax amounting RM 2.2 million. PBT remain flattish at RM 70 million in both 2017 & 2018. 
  • Gross profit margin reduced from 32% in 2013 to 25% in 2018, while net profit margin reduced from 13% in 2013 to 5% in 2018 due to strengthening of USD. 
  • Amway has a dividend payout policy of 80% from its profit, thus, the company has been consistently paying out 80 - 90% of its profit from 2013 - 2018.
  • Amway has a healthy and strong balance sheet with RM 176 million of cash on hand with no bank borrowings. 
  • Amway has been consistently generates positive cash flow from its operating activities over the years and the main reasons for negative cash flow from financing activities is due to dividend payout to shareholders.
  • Admin, selling & distribution expenses accounted for 73% of its gross profit in both 2017 & 2018. 
  • Inventory in 2018 reduced by 21% as compared to 2017. (not too sure is it because of business slowing down hence holding less stock?)
  • From the above comparison between USD/MYR and Amway share price, we can conclude that when USD is at high, Amway share price is at bottom as 90% of Amway import products are paid in USD while the selling price to the consumer is in MYR. This is the main reason that the profit margin of Amway is under pressure. (USD strengthen by 27% from 2013 - 2018, hence their gross profit margin also weaken by 21% from 2013 - 2018)

Future Prospect
  • Strive for greater sales revenue growth and continue to seek ways to optimise operational costs towards strengthening earnings going forward.
  • Focus on enabling ABOs to achieve their fullest potential and support the growth of their businesses.
  • Positive that sales revenue will continue to grow in FY2019 on the back of attractive sales and marketing plans and various growth initiatives that we have implemented to support ABOs in driving their business growth

Strength
  • Strong brand name (everyone know and heard of Amway) with stable revenue.
  • Strong balance sheet as Amway is a net cash company with net cash per share of RM 1.08.  
  • Generous with its dividend payout however their dividend reduced together with its earnings. 

Weakness
  • USD staying above RM4 is pain in the ass for Amway. 
  • The only way for Amway to return to their glory is through the strengthening of RM (The business growth for Amway is quite limited).
  • Inventory reduced in 2018 by 21%, will this means the business will be slower in 2019? or just a better movement on the logistic of its inventory? 
  • Slow economic will reduce people from buying more Amway products as Amway product is not cheap. 
  • Amway business is limited to Malaysia and Brunei only (however no info were provided on Brunei). 

Peer to Peer Comparison

  • The nearest MLM company that is similar to Amway will be Haio. 
  • Amway: Market Cap - 1.01B, PE - 18.61, ROE - 13.52, DY - 4.46, NTA - 1.32
  • Haio     : Market Cap - 750M, PE - 14.05, ROE - 17.35, DY - 7.97, NTA - 1.03, 


Valuation @ RM 6.17
  • At RM 6.17 a share, its current PE is 18.61 which is deemed to be quite fair unless moving forward its profit margin will increase with the strengthening of RM hence boost its earning (I personally think that the fair PE for Amway is around 18 - 20 looking at their previous record
  • USD has been staying at this level since 2016 (will this means Amway has bottom out?), and share price has dropped 40% from RM 10 in 2013 to the current level of RM 6 in 2019 (the drop in share price is in line with its decrease in net profit which is 50%)
  • However if you look at Q3 and Q4 in 2018, its EPS has started to recover with gross profit of 29% in Q4 2018 which is higher than its average gross profit of 25%. (This is something worth taking note)
  • Assuming moving forward, Amway is able to maintain this gross profit margin and generates an EPS of 11.5 sen per quarter in 2019 which translates into 46 sen of EPS. AT PE 18, Amway is worth RM8.28 (the calculation is compute by being optimistic that MYR will be below RM4.1 in 2019 and worth taking note that USD is ranging from RM4 - RM 4.1 from Nov 18 to Feb 19 to generate a gross profit of 29%)
  • Dividend yield at RM 6.17 is approximately 4.4%.


Power Root Berhad (Annual Report 2019 & Q4 2020)

Company Background Pwroot is an instant drinks manufacturer with different brands to target different customers.  Ah Huat instan...