Saturday, September 7, 2019

RCECAP Q1 2020

  1. Revenue increased by 5.8% while interest expense increased by 9.8%. 
  2. Allowances for impairment loss on receivables reduced by 28% which means the quality of the loan are improving. 
  3. Net profit improved by 3.9%. 
  1. Bank borrowings reduced by 8.8% hence gearing ratio further reduce from 1.91 to 1.81. This will reduce the interest expense of RCECAP and further strengthen its balance sheet.
  2. Loan and receivables grew by 1.5%. 

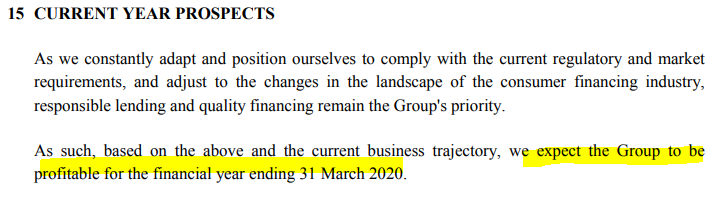
  • Nothing much being mentioned other than the group expect the company to be profitable. 


Comments
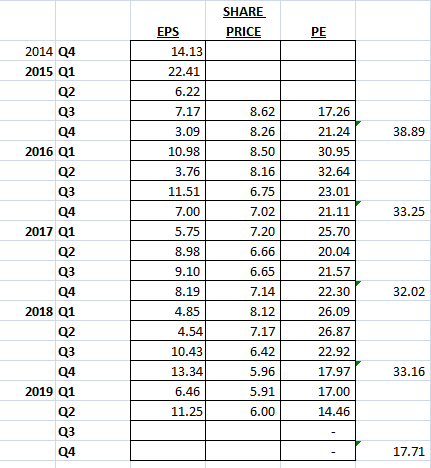
  1. Valuation of RCECAP at RM1.57
    • PE: 5.6 which is the lowest in the 5 years period considering the share price is at high. [undervalue]
    • CAGR from 2017 - 2019 is 5.54%, therefore at the PE of 5.6, its PEG ratio is 1.01 which is deemed to be fair.  If Rcecap dropped to RM1.5, its PEG ratio would be 0.97 which is undervalue. [undervalue]
    • DY: If the company do a dividend payout of 35% in 2020 or equivalent to 10 sen, its DY would be 6.4% (this is comparable to Maybank dividend yield) [undervalue]
    • NTA is RM1.65 which is higher than its share price of RM1.57. [undervalue]
    • Price to book value is currently 0.87 which means we are paying 0.87 sen for a company asset that worth RM1.[undervalue]
    • ROE is 15 which is 2 times higher than its PE. [undervalue]
    • RCECAP fair PE should be 7 to 8.  At PE 7 Rcecap is worth RM1.96. At PE 8, Rcecap is worth RM2.24.

Friday, September 6, 2019

Rce Capital Berhad (AR 2019)

Company Background

  • Rcecap is a subsidiary of Amcorp Group Berhad and involved in 3 business segment namely:
    • Consumer Financing - Provide personal financing to government employees where the repayment are done through a salary deduction scheme whereby the installment payments are deducted from salary of those participating employees on a monthly basis. (only focus on personal loan)
    • Commercial Financing - Factoring (business sells its accounts receivables at a discount to a factoring company which provides quick cash to the business) & Confirming  (business needs to confirm an order of goods and the confirming company undertakes to pay the supplier of goods upon delivery on behalf of the business).
    • Payroll collection - EXP’s collection service attends to deductions in payroll systems of government departments under the purview of Accountant General’s Department of Malaysia.
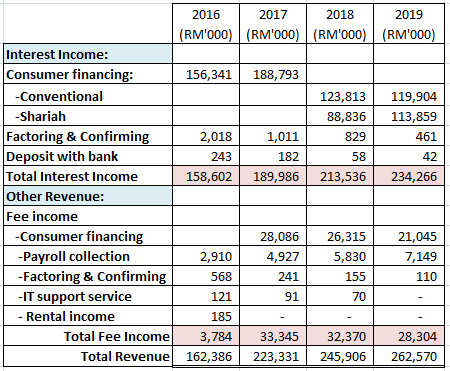
  • Rcecap derive its income mainly from consumer financing which accounts for 89% of its revenue in 2019. 
  • Minimum dividend payout ratio of 20% - 40% of its net profit. 

  • Rcecap is listed in 1994 and transfer to the main board in 2006 and introduce payroll collection business in 2014.


Financial Highlight

  1. We will focus its growth starting 2017 as RCECAP consolidate every 4 shares into 1 in 2017. Their NPL prior to 2017 is extremely high due to low quality of loan. However, the company started to focus on the quality of loan and consolidate its shares to make the company better. 
  2. CAGR on revenue and net profit from 2017 - 2019 was 5.54% and 6.56% respectively. 
  3. CAGR on EPS from 2017 - 2019 was 5.47% which is in line with its revenue and net profit growth.
  4. Dividend payout increase every year form 2017 - 2019 and in 2019 the company have a dividend payout ratio of 32%. (Bear in mind that the company is willing to share its profit up to 40% with its shareholder)
  5. Since it consolidate its shares in 2017 its ROE improved to 17% from below 10% which is on par with the ROE of Aeoncr. 
  6. Gross financing and net financing receivable grew at CAGR of 4% from 2017 - 2019 however its gearing ratio actually decreased. This means the company utilized its equity effectively. 
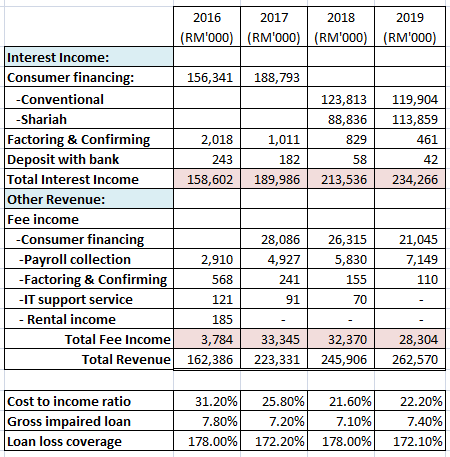
  7. Non performing loan also decreased to 4% since it consolidate its shares. 

  1. Its interest income grew steadily from 2016 to 2019. 
  2. Cost to income ratio improved from 31.2% to 22.2% in 2019 which is a big improvement in cost control. 


Future Prospect
  1. Remain focus in the niche market and bringing in quality loan remain as main priority to bring down the non performing loan. 


Strength
  1. Focus on quality loan from government servant where the salary will be auto deducted for payment to Rcecap before paying to the borrower. 
  2. Management team is willing to share its profit with its shareholder. Dividend payout in 2017: 3sen, 2018: 7sen, 2019: 9sen. Management is willing to share up to 40% of its profit with its shareholder. 
  3. Low gearing ratio which means there is more room for the company to take up more loan to expand its business. 
  4. Improvement in management effort to improve its cost to income ratio as well as to reduce its non performing loan. 

Weakness
  1. Limited business segment as the company only focus on personal loan of civil servant. 
  2. Unable to check  CCRIS from bank negara to ensure the debts payment background of the borrower however the salary of the civil servant will be deducted automatically to settle the loan before paying out to the borrowers. 

Valuation
  • 2017: Share price - RM1.69, EPS - 23.89sen, PE - 7.07
  • 2018: Share price - RM1.25, EPS - 26.02sen, PE - 4.80
  • 2019: Share price - RM1.63, EPS - 28.02sen, PE - 5.82
  • From the above comparison, we can see the its EPS grew 17% however its share price maintain at RM1.60. 
  • Assuming if  Rcecap distribute 10 sen of dividend in 2020, at the price of 1.55, its DY is 6.5%. 
  • Rcecap is worth PE of 7 - 8. At PE 7 Rcecap is worth RM1.96. At PE 8, Rcecap is worth RM2.24


Technical Analysis
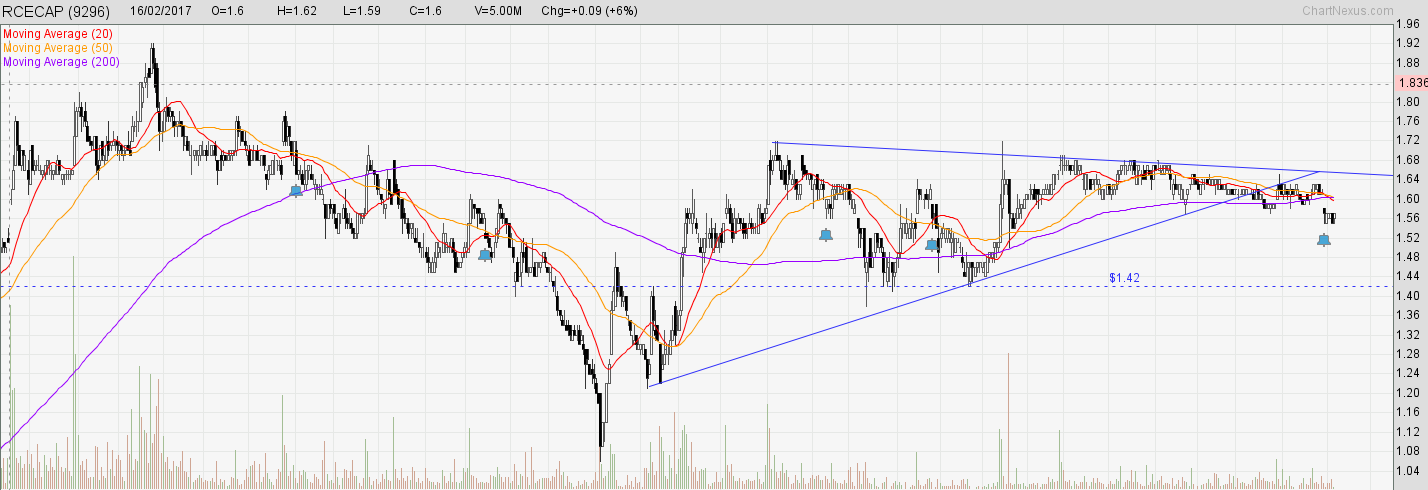
  • Rcecap is currently trading below its short term and long term moving average and the next support is seen at 1.42. 


Sunday, September 1, 2019

YSPSAH Q2 2019

  1. Revenue increased by 3.5% however gross profit reduced 7.3% due to increase in raw material cost. Gross profit margin was 44.48% while profit before tax margin was 10.56% which is still acceptable. 🔻
  2. Selling, distribution and admin expenses increased by 10% which is higher as compare to revenue increase of 3.5%. 🔻
  3. Finance cost increased by 63% however this do not post as a threat to the company as the company have interest income to offset. =
  4. Net profit dropped by 35% mainly due to higher cost of goods sold, higher operating expenses, higher depreciation of RM 1.9 million and foreign exchange loss of RM 501K, last year there is a forex gain of RM 2.1 million as shown in the info below. Last year, the company spend RM 28 million on purchase of PPE, the higher depreciation expenses should derive from there.🔻 


  1. Although the profit of YSPSAH drops, however its net cash generated from operating activities increase thus increase its cash position to RM 0.39 sen per share. 🔺

  • The management were cautiously optimistic of its performance moving forward. =


Comments
  1. It is quite obvious that YSPSAH wont be able to achieve a higher net profit for 2019 as its current net profit cumulative 6 months is only 36% of 2018 profit. However, its cash flow still remain strong. 
  2. Valuation wise, YSPSAH is currently trading at RM 2.31, PE is 13, DY is 3.6%. PE 13 is deemed to be fairly value for YSPSAH. Assuming if the full year EPS is 18 sen for YSPSAH, at PE 10, YSPSAH is at RM1.8, its DY will be 4.7%.

Amway Q2 2019

  1. Revenue increased by 3.3% while gross profit increased by 18.6% as product buy up activities ahead of price increases effective mid-March and mid-April 2019. 
  2. Distribution and selling and admin expenses remain flat which is good. 
  3. Profit before tax increased by 83% due to higher sales and lower import cost primarily attributed to favorable foreign exchange impact.
  1. Operating cash flow generated from operating were RM 51 million for 6 month cumulative which accounts for full year operating cash flow for the past 3 years. 
  2. The company has a net cash of RM 198 million which equivalent to RM 1.21 net cash per share. 
  • Movement of USD/MYR for April, May & June 2019. Its average is around 4.15.


  1. The management is optimistic of Amway growth in 2019. 


Comments

  1. The net profit margin improved to 6.1% which is the highest level since 2016 as Amway increase their product price effective April 2019. This is something worth taking note as dividend payout ratio of Amway is 80% - 90%. Therefore, increase in EPS would lead to increase in dividend payout. 
  2. Assuming if the EPS for the year is 35 sen, 85% dividend payout would be 30 sen. At RM6 a share, its DY is 5%. 
  3. At RM6 a share, its PE is 14.4 which is the lowest in 5 years. As mention in my previous post, a reasonable PE for Amway is 18 - 20. Assuming Amway is able to achieve an EPS of 35 sen, At PE 18 Amway is worth RM6.30. At PE 20, Amway is worth RM7. 


Saturday, August 31, 2019

GENM Q2 2019


  1. Revenue grew by 10.7% while gross profit grew by 7.1%. Gross profit margin and net profit margin remain stable at 25% and 12% respectively. 
  2. Other expenses increased by 32.8% as a result of the termination of contracts related to the outdoor theme park at Resorts World Genting of RM138.0 million (impairment).
  3. Impairment loss reduced by RM12 millions. 
  4. Finance cost increased by 72.6% as the company's bank borrowings increased. RM126 million accounts for 16% of its profit before tax. According to management, the increase of finance cost is due to lower qualifying assets eligible for interest capitalisation during the period, upon completion of certain projects under GITP
  5. Tax rate for 6 months cumulative was 13% in 2019 versus 16% in 2018. Tax rate were actually lower even after the tax rate hike. (I think there are still some tax incentive to cushion it)
  6. Profit after tax were lower by 8.8% which we will explain later. 


  1. Revenue from Malaysia increased by 15% however it EBITDA only increased by 2% due to higher casino duty however it is offset by higher revenue and lower payroll and related expenses as a result of reduction in the number of employees.
  2. Revenue from UK & Egypt dropped by 1% however its EBITDA increased by 43% due to impact of adopting MFRS 16 and was partially offset by lower debts recovery in 1H 2019.
  3. Revenue from US and Bahamas increased by 8% while its EBITDA increased by 18% due to the strengthening of USD against RM. Excluding this impact, revenue would have increased by 3% mainly due to higher volume of business from RWNYC operations.. 
  4. Main reason for profit before tax to decrease is due to higher pre-opening expenses of RM112 millions due to provision for termination related costs relating to the outdoor theme park of RM138.0 million,  and lower interest income of RM112 millions due to impairment of the Group’s investment in the promissory notes issued by the Tribe in 2018. 

  1. Cash at bank reduced by RM 1,022 million while bank borrowings increased by RM 2 million. Main reason for the cash to reduce was for purchase of PPE amounting RM1579 million. 

  1. The theme park is expected to open soon which can mitigate the increase in tax rate hike in malaysia. 
  2. Genm will continue to reduce its operating cost by improving efficiency. 
  3. First phase of group expansion at RWNYC will open and increase in business in NYC should be able to mitigate or cushion the losses from Empire Resort next year. 


Comments:

  1. Genm business is still growing proven by its increased revenue and gross profit (organic growth).
  2. Gearing ratio of the company increased from 9% to 15% and its finance cost increased significantly which can post as a risk to the company's ability to distribute special dividend. 
  3. The opening of theme park should boost its business and mitigate the losses from Empire Resort however the cash of the company would further deteriorate after acquiring Empire Resort which might affect the company's ability to distribute special dividend.
  4. Valuation wise, i think at currect price of RM3.12 its PE is only 13.5 which is still way below its reasonable PE of 18. At PE 18, Genm is worth RM 4.32. 


Thursday, August 22, 2019

Ptrans Q2 2019

  1. Gross profit improved to 42.48% cumulative quarters in 2019 VS 39.85% in 2018 (well done to the team for controlling the COGS effectively).
  2. Revenue increased by 3% however its general and administrative expenses dropped by 0.3% (another thumbs up to the management team for controlling the admin expenses so well).
  3. Other operating income was higher by 138% or RM 2.2 million due to higher rental income from rental of construction equipment. 
  4. Finance cost is higher this quarter and accounts for 20% of profit before tax as their bank borrowings was higher. Although the company's bank borrowing was higher, however the gearing ratio actually dropped from 64% to 62% which is good. 
  5. Profit before tax improved by 23% however profit after tax only improved by 1.8% due as cumulative quarters for 2018, there is a tax income of RM 2.7 million. Nevertheless, the tax rate for the current quarter is only 3.3%.
  6. Although the company has higher net profit, but its EPS dropped by 9.7%. This is due to increase in number of shares result from warrant conversion. Number of shares increased by 6.2%.


  1. Cash flow from operating is higher at RM 17 million compare to RM 13 million previously. 
  2. Cash from used in investing is lower at RM 15 million compare to RM 38 million previously. 
  3. From the above calculation, we can conclude that with higher operating cash flow and lower investing activities, PTRANS is able to generate more free cash flow moving forward to pair down its debts as well as used for dividend payout. 


  1. Revenue was higher by RM 4 million for its terminal operations however operations from petrol station and buses are slightly lower by 10% and 0.9% respectively. 


  1. Q2 usually serves as the strongest quarter for PTRANS as there are more long weekends, public holidays and school holidays. 


  1. Terminal Kampar has commenced its terminal operation at the end of 2nd quarter. Meaning we could see its contribution at the end of second quarter of 2019. 


Comments
  1. Better efficiency is seen from the company profit and loss account for the cumulative quarters in 2019.
  2. Balance sheet becomes stronger as PTRANS has a free cash flow of RM4.6 million for cumulative quarters in 2019. As long as if the company do not immediately start its 3rd terminal project, i believe PTRANS could pair down its debts and further strengthen its balance sheet in a short period. 
  3. The only uncertainty now is when the revenue and expenses from terminal kampar kicks in next quarter, will the overall company earnings being lifted or dragged lower? 
  4. However according to Affin Hwang report: Terminal Kampar’s ground floor operations — comprising bus services, advertising and promotion as well as rental of four shoplots and eight kiosks — have kicked off with a 90% occupancy rate, while the overall expected take-up rate from prospective tenants for the entire mall stands at 70%.Furthermore, most of the anchor tenants — cineplex, gym, bowling alley and supermarket — have been secured.
  5. If Terminal Kampar will generate some good cash flow, then the additional shares from warrant conversion and high gearing ratio would not be an issue. 
  6. Assuming if PTRANS have an full year EPS of 2.52 sen, a 35% dividend payout will be 0.89 sen. PTRANS has paid out 0.25 sen in Q1, therefore expecting another 0.64 sen to be paid out in Q3. At current price of RM 0.195, DY is set to be 4.5%
  7. Valuation wise, for 2.52 sen of EPS a year, its PE at RM 0.195 is 7.7 which is deemed to be undervalue if Terminal Kampar is lifting its earning. 


Tuesday, August 13, 2019

Genm acquire 46% of Empire Resorts with RM 540 millions and its Impact on Genm Financial


  • Genm is acquiring 46% of Empire Resort for RM 540 millions. 

Financial Highlights for Empire Resort in 2018 & 2019
  • According to Bloomberg, Empire Resort losses USD 140 millions (RM 590 millions) in year 2018 which is the highest over the past 4 years. 
  • Empire Resort losses USD 36 millions (RM 150 millions) in Q2 2019. Assuming Empire Resort incurred the same losses in Q3 & Q4 2019, that would be a loss of USD144 millions (RM 600 millions). 
  • Genm acquire 46%, meaning RM 276 millions of the losses will impact on Genm result. 


Financial Highlights for Genm in 2019
  • Genm generates profit after tax of RM 253 millions in Q1 2019. Assuming if Genm consistently generates the same amount over the remaining quarters, profit for 2019 would be RM 1012 millions. 
  • However do take note that there is a one off pre opening expenses of RM 210 millions and one off gain on disposal of RM 123 millions in Q1 2019. I do not expect this expenses to appear in Q2 2019, therefore, Q2 2019 result are expected to be better. 
  • If exclude the pre opening expenses and one off gain on disposal, Genm profit after tax should be RM 369 millions. Therefore, a full year estimation would be RM 1476 millions.


Impact of Empire Resorts losses on Genm Financials

Scenario 1 (pessimistic) 
  • RM 1012 millions - RM 276 millions = RM 736 millions
  • RM 736,000,000 / 5,659,071,000 shares = EPS 13 sen for year 2019
Scenario 2 (optimistic)
  • RM 1476 millions - RM 276 millions = RM 1200 millions
  • RM 1,200,000,000 / 5,659,071,000 shares = EPS 21 sen for year 2019


Valuation
  • At RM 3.12 a share, PE of Genm is 14.8 assuming the EPS is 21 sen.
  • At RM 3.12 a share, PE of Genm is 24 assuming the EPS is 13 sen.
  • A fair PE of Genm should be around 15 - 17. 

Key Things to Ponder
  • Will the reopening of theme park in end 2020 or early 2021 cushion the additional losses contributed by Empire Resort?
  • Will the voluntary bankruptcy debts restructuring under chapter 11 help Empire Resort to reduce its debts hence reduce its losses? 
  • The core value of Genm is that it is the only casino in Malaysia and Genting remain as one of the most popular tourist destination/short get away for Malaysian due to its weather and portrait as an all rounder to entertain family from adults to kids. Has the core value of Genm being broken at this stage? 
  • More over, Genm has been consistently generating a positive cash flow from operating amounting RM 1500 millions to RM 2000 millions every year . How massive is the impact of RM 300 millions of losses from Empire resort? RM 300 / RM 1500 = 20%. 
  • Share Price of Genm before the news announcement is RM 3.61. RM 3.61 discounted by 20% would be RM 2.88. Therefore, RM 2.90 should serve as a very strong support fundamentally. 

Power Root Berhad (Annual Report 2019 & Q4 2020)

Company Background Pwroot is an instant drinks manufacturer with different brands to target different customers.  Ah Huat instan...